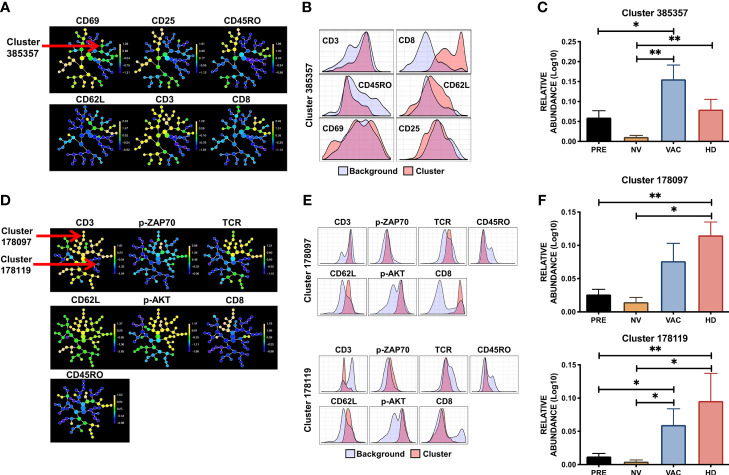
Figure 5.
Specific population of T cells are favored by combination therapy NAC + dendritic cells (DCs). CITRUS analysis of peripheral blood mononuclear cell (PBMC) samples obtained from healthy donors (HDs), before chemotherapy (PRE), non-vaccinated (NV), and vaccinated (VAC) patients based on the T-cell receptor (TCR) signaling FC panel. (A) Cluster distribution (hierarchy) and expression level of the corresponding marker from low (blue) to high expression (yellow) for each marker, arrow points at cluster 385357. (B) Histograms depicting the phenotype of cluster 385357 (red histograms) relative to background expression (blue histograms) for each marker (CD3, CD8, CD45RO, CD62L, CD25, and CD69). (C) Relative abundance (Log10) of cluster 385357 in the four groups, patients before chemotherapy (PRE, black bars), post-chemotherapy alone [non-vaccinated (NV), yellow bars], vaccinated patients (VAC, blue bars), HDs (red bars). (D) Cluster hierarchy and expression levels of TCR signaling panel in ex vivo samples, arrows point to clusters 178097 and 178119. (E) Histograms of clusters 178097 and 178119 (red histograms) compared to background expression (blue histograms) in each cluster. (F) Relative expression (Log10) of clusters 178097 and 178119. Non-parametric Mann–Whitney test between populations or groups. *p < 0.05, **p < 0.01.

