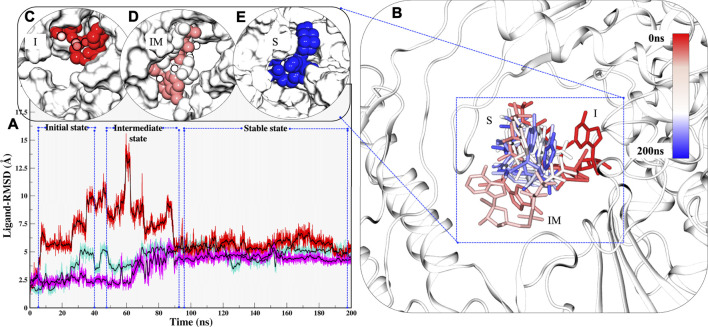
FIGURE 3.
Estimation of different RTP states at MD scale. (A) RTP stability in different runs, Run1: Turquoise, Run2: Magenta and Run3: Red. (B) Three different states were observed, I: Initial state, IM: Inter-mediate state and S: MD stable state, where RTP is shown in licorice and protein in new cartoon. The conformations of RTP are shown in licorice with time-step coloring method, RTP conformation shown in vdW and protein is represented in surf at (C) I state (D) IM state and (E) S state.

