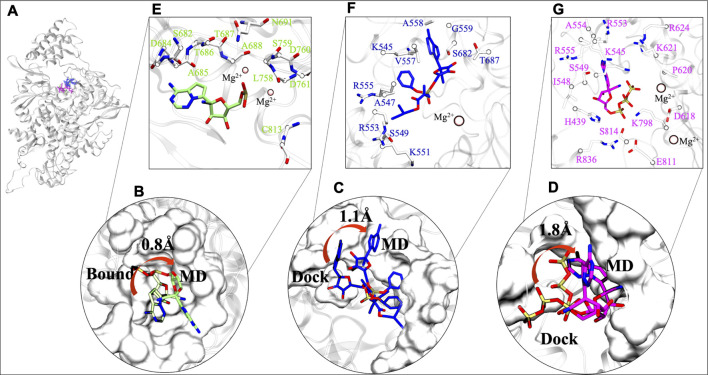
FIGURE 4.
Comparative interaction patterns of RMP, RDV and RTP MD poses. (A) MD poses of RMP, RDV and RTP in RdRp. (B) RMP’s comparison between its bound and MD representative state (C,D) RDV and RTP comparison between docked and MD representative state, respectively. (E–G) Arrangement of these molecules at their most stable state, RMP (snapshot: 97.51 ns), RDV (snapshot: 96.31 ns) and RTP (snapshot: 198.56 ns) are lined by respective residues. Interacting residues are shown uniformily in white and licorice representation and small molecules RMP, RDV and RTP in lime, blue and magenta rendered in licorice. Catalytic ion Mg2+ is represented in Beads:pink.

