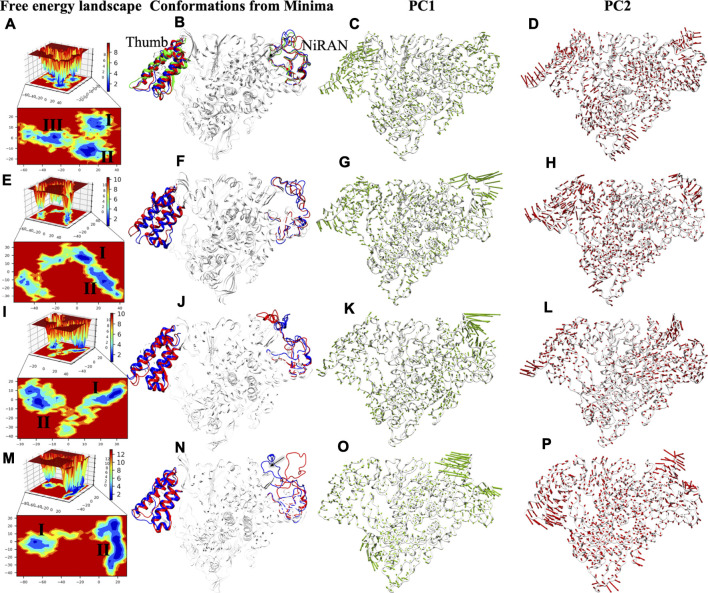
FIGURE 8.
FEL analysis and porcupine plots of SARS-CoV-2 RdRp in bound and unbound states. The panels (A,E,I,M) of 2D and 3D free energy landscape (FEL) plots between PC1 (x-axis) and PC2 (y-axis) for APO, COM-RMP, COM-RDV and COM-RTP respectively. The color bar represents the Gibbs free energies in the plot ranging the lowest energy (blue) to highest energy (red) conformation states. The low energy minima states are shown in the 2D FEL plots. The minima extracted from FEL plots are superimposed for all simulated structures depicting the conformational changes in the panels (B,F,J,N). The red, blue and green conformations represent the minima I-III respectively in the panels (B,F,J,N). Porcupine plots generated using extreme PC1 panels (C,G,K,O) and PC2 projections panels (D,H,L,P) for all the four simulated systems. The direction of the green and red arrows (in PC1 and PC2 respectively) at each Cα shows its direction of motion and the length of arrow depicts its strength. The protein is represented in tube form and colored in white. The regions that are highly fluctuating are labelled.

