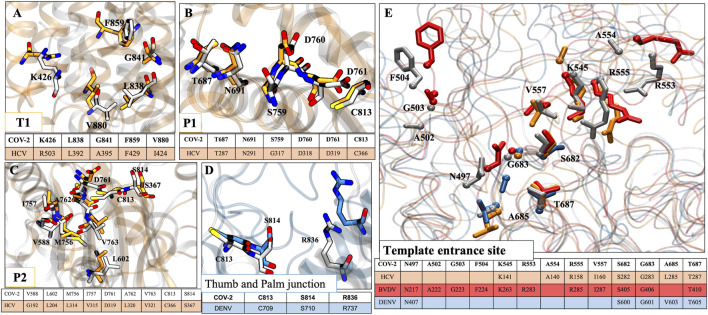
FIGURE 9.
Conservity analysis of allosteric sites in different viral RdRp’s. The panels (A–C) represent three conserved allosteric sites in HCV and CoV2 RdRp. Panel (D) represents conserved allosteric sites in DENV and CoV2 RdRp. (E) The conservation analysis of template entrance site (TES) in CoV-2, HCV, BVDV and DENV. For figure clarity, only sidechain and Cα atoms of residues are shown in this panel. The respective tables at every panels corresponds to conserved residues obtained after structural alignment. Residues color coding is done as follows: HCV: orange, CoV2: white, DENV: blue, BVDV: red.

