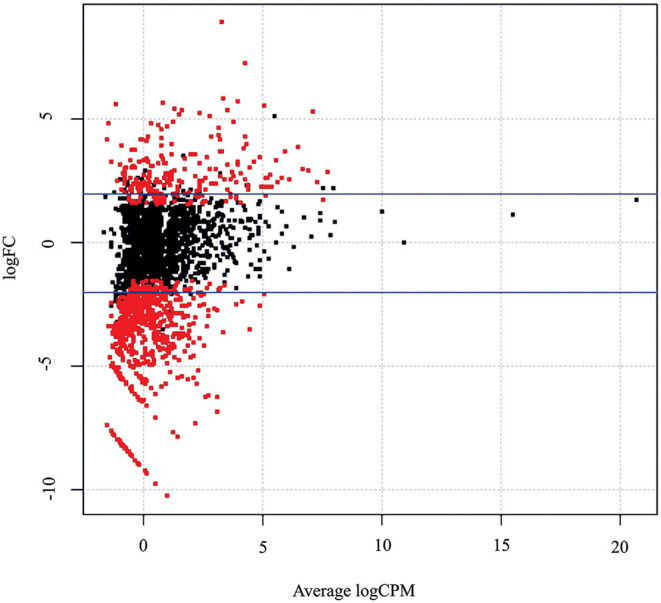
Figure 4.

Differentially expressed genes in M. glaucescens explants before (control) or after (treated) shoot organogenesis induction. Blue lines indicate genes with no significant changes in expression (1,241 genes); whereas red dots indicate genes that were either significantly downregulated (226) or upregulated (591) in treated explants. The false discovery rate was set at P ≤ 0.05. FC, fold change; CPM, counts per million mapped reads.
