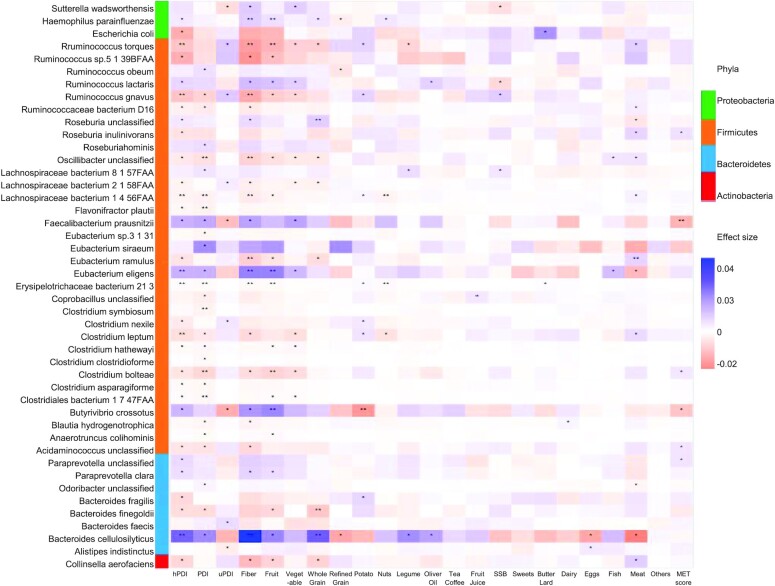
FIGURE 1.
Heatmap of the species that significantly associated with PDIs, fiber, and individual food groups based on 911 repeated measurements of the 303 participants. Effect size colors are based on the relative abundance (arc sine of square root of the normalized abundance values) changes with per SD increasing of PDIs, foods, fiber, or MET score. Filtering criteria: relative abundance <0.001% at 10%+ samples. Generalized linear mixed-effects regressions implemented in MaAsLin2 were adjusted for repeated measurements (participant's ID as random intercept), age, energy intake, alcohol, smoking, physical activity, using of antibiotics, consumed any probiotics, and fecal sample characteristics). hPDI, healthy plant-based diet index; MET, metabolic risk; PDI, plant-based diet index; SSB, sugar-sweetened beverage; uPDI, unhealthy plant-based diet index.

