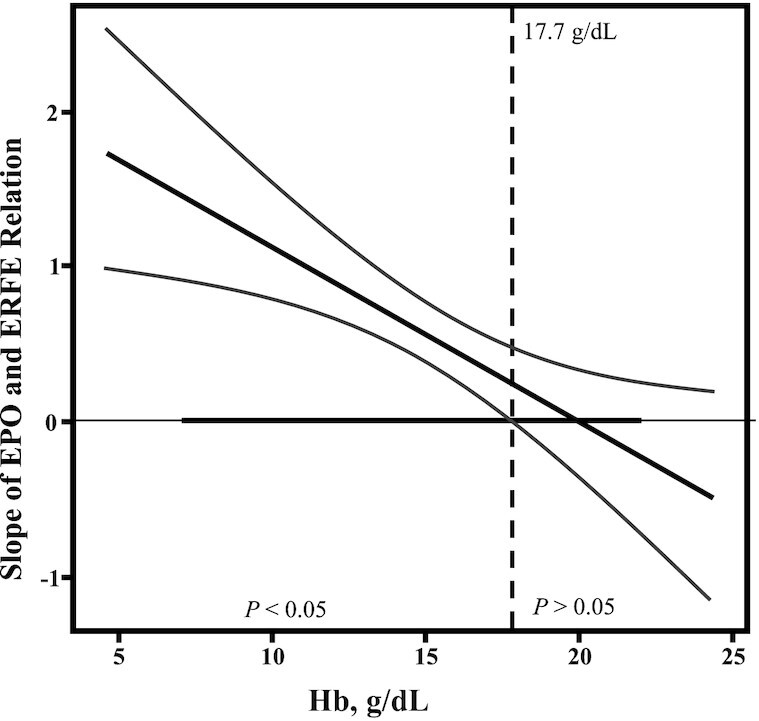
FIGURE 2.

Relations between EPO and ERFE in cord blood were influenced by cord blood Hb concentrations. Johnson–Neyman analysis was undertaken to further assess the interaction between the independent variables EPO and Hb on the dependent variable ERFE concentration. The strength and significance of the relation between EPO and ERFE change as neonatal Hb concentration increases. The x axis indicates the range of Hb concentrations in umbilical cord blood. The y axis indicates the slope for the regression between EPO and ERFE. The thick solid black diagonal line demonstrates the slope of EPO and ERFE per Hb concentration, with the curved lines being the 95% CI. The thick solid black line on the x axis indicates the range of observed data. The dotted line indicates the Hb concentration (17.7 g/dL) for which neonates with Hb concentrations above this value no longer have a significant relation between EPO and ERFE, whereas neonates with Hb concentrations <17.7 g/dL have a significant relation between EPO and ERFE (P < 0.05). EPO, erythropoietin; ERFE, erythroferrone; Hb, hemoglobin.
