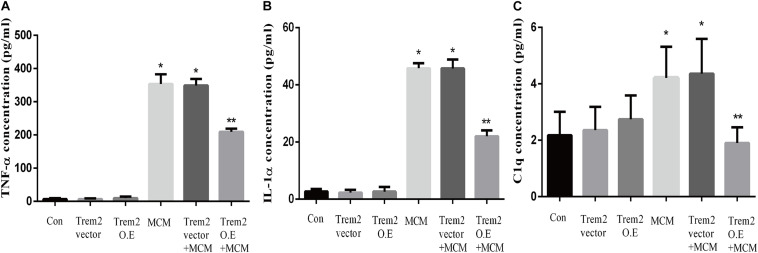
FIGURE 8.
Concentrations of IL-1α, TNF-α, and C1q were tested in MCM, Triggering receptor expressed on myeloid cells 2 (TREM2) (vector or overexpression) transfection-conditioned mediums, and TREM2 (vector or overexpression) + MCM. The concentration levels were measured using ELISA kits. (A) Concentration of TNF-α. (B) Concentration of IL-1α. (C) Concentration of C1q. Differences between the means were determined by t test. *p < 0.05 versus control at the match time point, ** p < 0.05 versus LPS (0.1 ug/m) at the match time point. The data are expressed as means ± SEM from three independent experiments. C1q: complement component 1q; IL-1α: interleukin 1α; TNF-α: tumor necrosis factor-α.

