Figure 5.
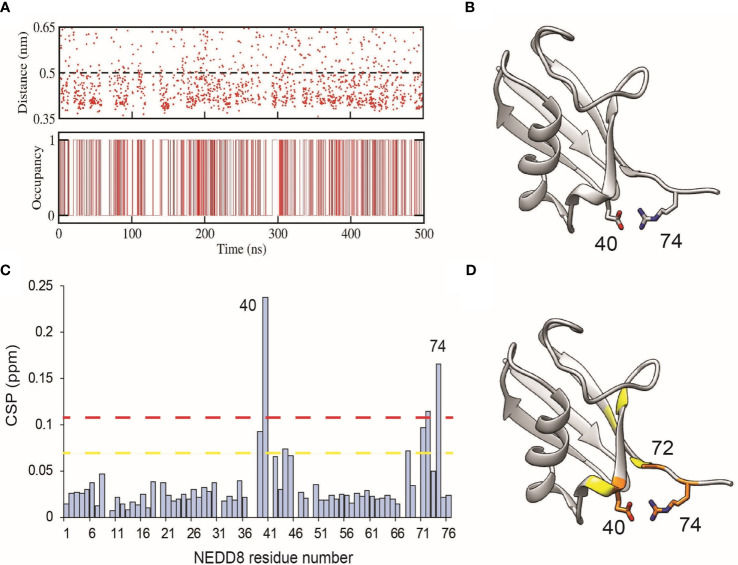
Formation of an intramolecular salt-bridge in dNEDD8. (A) Salt-bridge stability as a function of time in a 500 ns MD simulation of dNEDD8. In the bottom plot, salt-bridge occupancy is shown as either 1 or 0 to indicate the presence or absence of a salt-bridge, respectively. Salt-bridge occupancy was calculated using a 0.5 nm cutoff. The occupancy of the salt-bridge was calculated to be 44.2%. (B) MD snapshot showing the formation of R74-E40 salt-bridge in dNEDD8. (C) The NMR CSP plot showing the effect of Q40E substitution in NEDD8. The CSP = [(δHNEDD8 - δHdNEDD8)2 + (δNNEDD8 - δNdNEDD8)2/25]1/2, where δHNEDD8 and δHdNEDD8 are amide proton chemical shifts of residue in wt-NEDD8 and dNEDD8, respectively. The dashed yellow line and red line denote Mean+SD and Mean+2*SD, respectively. (D) The residues with high CSPs are mapped onto the NEDD8 structure. The residues with CSP above Mean+SD are colored yellow, and the residues with CSP above Mean+2*SD are colored orange.

