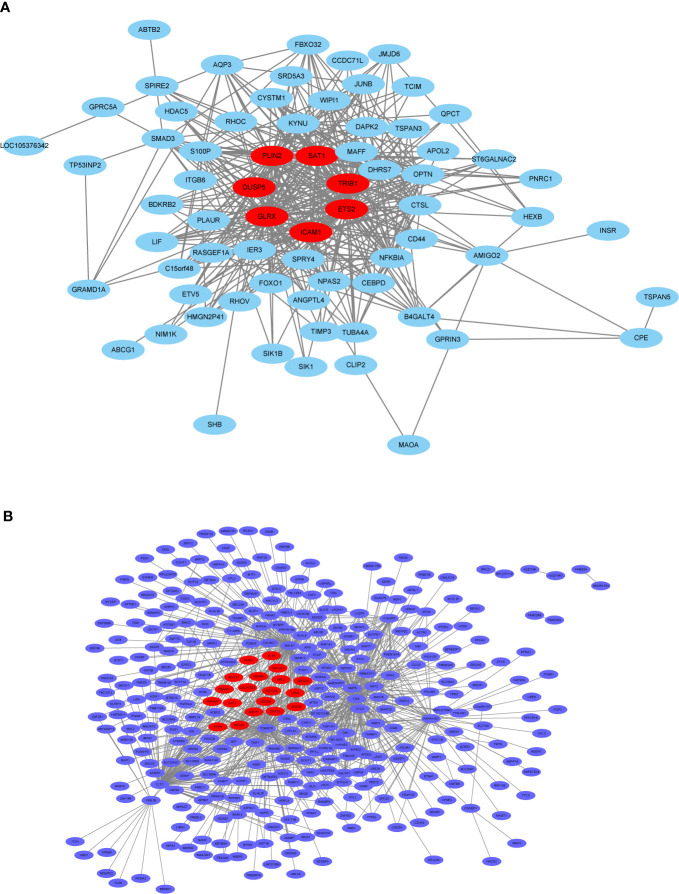
Figure 10.
The co-expression network. (A) The co-expression network of the significant genes in the thistle2 module, including 72 nodes. (B) The co-expression network of the significant genes in the blue module, including 728 nodes. The hub genes were represented in red color. Cytoscape (v3.8.1) software was downloaded from the website (https://cytoscape.org/) and three models were chosen including “source node”, “target node”, and “edge attribute” with default parameters.

