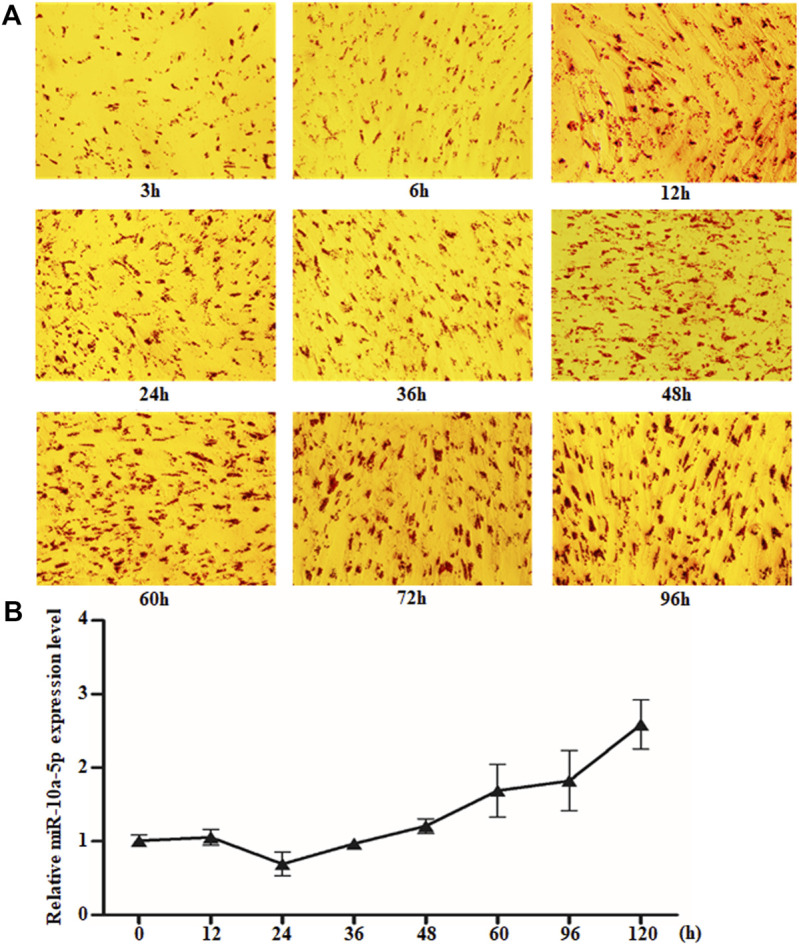
FIGURE 1.

miR-10a-5p expression changed obviously during GIPC differentiation. (A) Representative images of Oil O staining of GIPCs cultured in oleic acid induction medium for different hours. (B) qRT-PCR analysis of the relative level of miR-10a-5p expression in GIPCs cultured in oleic acid induction medium for the hours as indicated. N > or = 3 for A and B.
