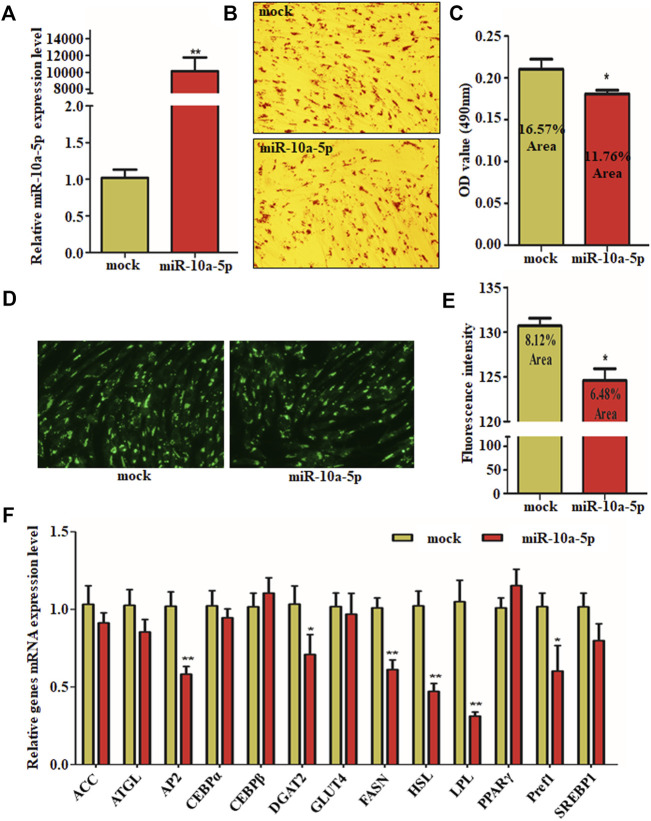
FIGURE 2.
Overexpression of miR-10a-5p inhibits GIPC differentiation. (A) qRT-PCR analysis of levels of miR-10a-5p expression in GIPCs with mimics or control transfected for 24 h. (B) Representative images of Oil Red O staining of GIPCs with miR-10a-5p mimics or control and (C) semi-quantitative assessment of Oil Red O content absorbance detection at 490 nm. (D) Representative images of mature adipocytes stained with BODIPY and (E) stained area was measured using ImageJ. (F) qRT-PCR analysis of levels of genes expression in GIPCs with miR-10a-5p mimics or control. N > or = 3, * indicates p values < 0.05 and ≥ 0.01, ** indicates p values < 0.01.

