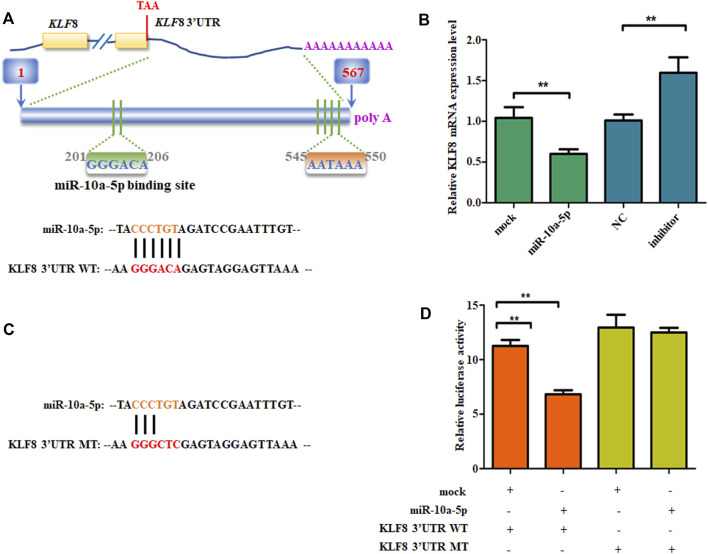
FIGURE 4.
miR-10a-5p directly bind to KLF8 3’UTR. (A) The predicted miR-10a-5p binding site in KLF8 3’UTR. (B) qRT-PCR analysis of levels of genes expression in GIPCs with miR-10a-5p mimics, inhibitor, or each control. (C) mutant miR-10a-5p binding site in KLF8 3’UTR. (D) Luciferase assay of transfected with wild-type or mutant KLF8 3’UTR plasmid in 293T cells. N >or = 3 for B and D, * indicates p values < 0.05 and ≥ 0.01, ** indicates p values < 0.01.

