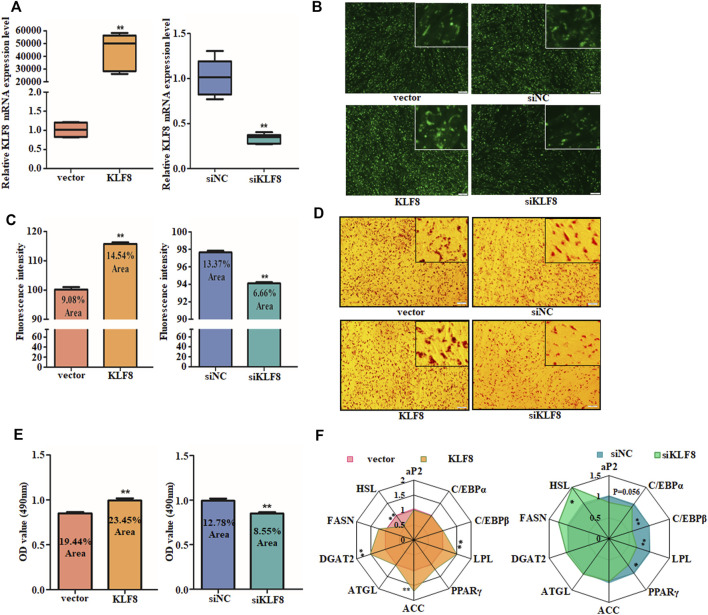
FIGURE 5.
KLF8 promotes GIPC differentiation. (A) qRT-PCR analysis of levels of KLF8 with KLF8 siRNA, expression plasmid, or each control transfected for 24 h. (B) Representative images of mature adipocytes stained with BODIPY and (C) stained area was measured using ImageJ. (D) Representative images of Oil Red O staining of GIPCs with miR-10a-5p inhibitor or control and (E) semi-quantitative assessment of Oil Red O content absorbance detection at 490 nm. (F) qRT-PCR analysis of genes expression in GIPCs with KLF8 up- or downregulation, the result was showed by a network diagram. N >or = 3 for B and D, * indicates p values < 0.05 and ≥ 0.01, ** indicates p values < 0.01.

