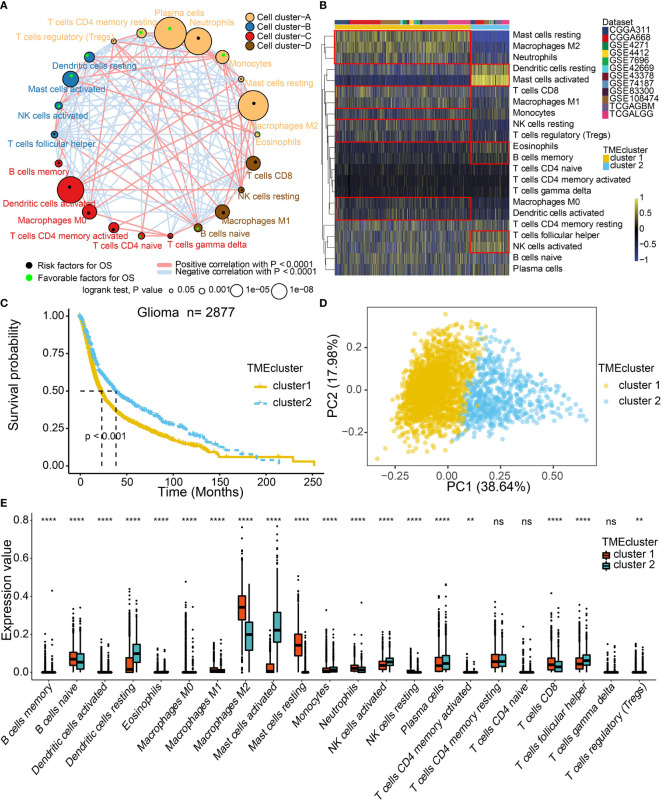
Figure 2.
TME landscape in gliomas and characteristics of TME subtypes in the meta-cohort. (A) Cellular interaction of the TME cell types. (B) Unsupervised clustering of TME cells for 2877 patients in the meta-cohort. (C) Kaplan–Meier curves for two TME groups of 2877 patients in the meta-cohort. Log-rank test, P < 0.001. (D) PCA separated the two TME clusters. (E) Fraction of TME cells in two TME clusters. The scattered dots represent TME cell expression values within each group. NS, Not Statistically Significant; **P < 0.01; ****P < 0.0001.

