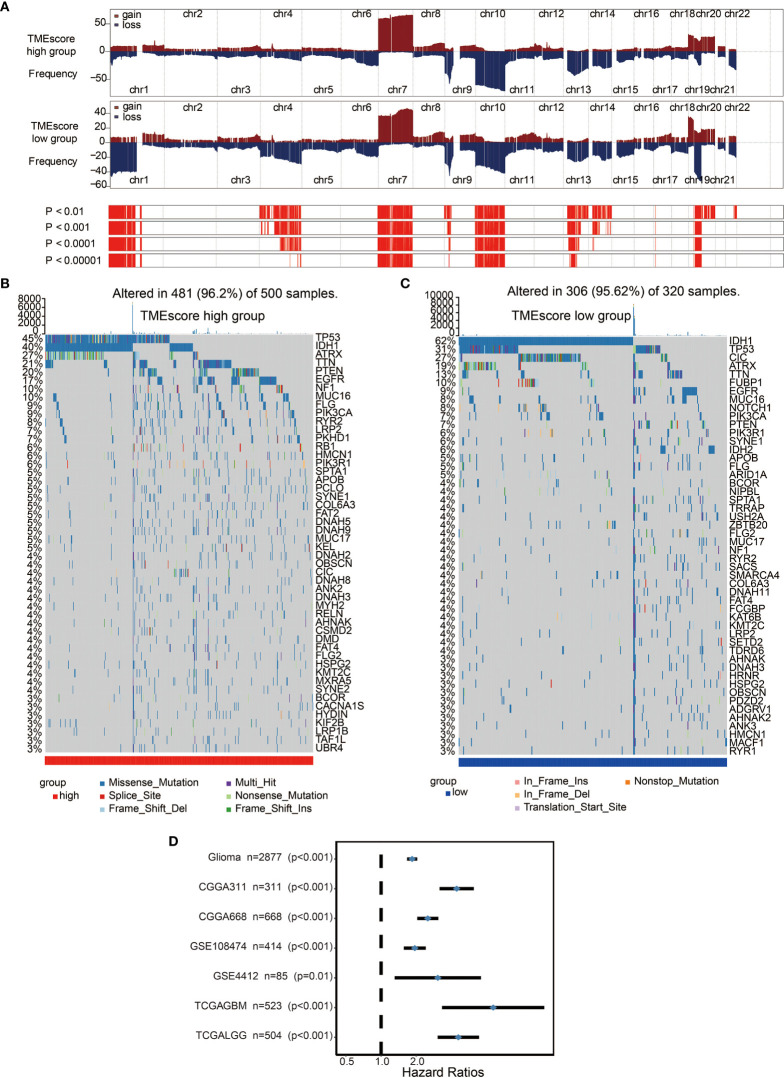
Figure 4.
Distinct genomic profiles associated with the TME-score. (A) GISTIC 2.0 amplifications and deletions in gliomas with high and low TME-scores. Chromosomal locations of peaks of significantly recurring focal amplifications (red) and deletions (blue) are presented. (B) Differential somatic mutations were detected in gliomas with high TME-score. (C) Differential somatic mutations were detected in gliomas with low TME-score. (D) Subgroup analyses estimating the clinical prognostic value between low/high TME-score groups in independent glioma datasets.

