Figure 1.
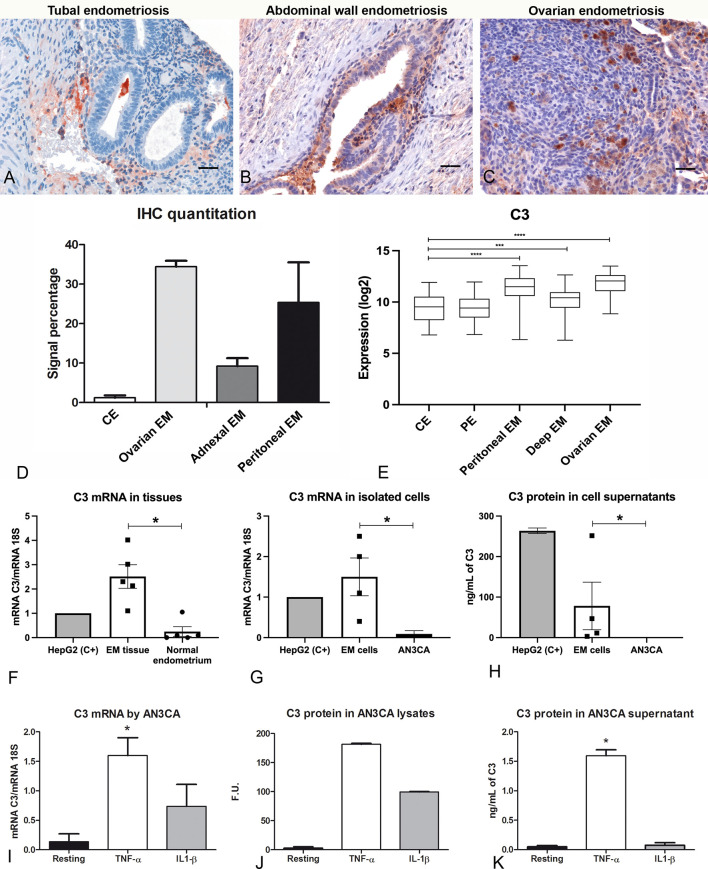
C3 is locally produced in human endometriotic tissue, which is up-regulated by pro-inflammatory cytokines. Representative microphotographs showing expression of C3 by IHC in tubal (A), abdominal wall (B) and ovarian (C) endometriosis (EM). AEC (red) chromogen was used to visualize the binding of anti-human C3 antibodies. Nuclei were counterstained in blue with Harris Hematoxylin; scale bars, 50μm. (D) Quantitative analyses of C3 IHC staining were carried out by calculating the average percentage of positive signals in five non-overlapping fields for each sample (normal endometrium, n=3; ovarian EM, n=3; adnexal EM, n=3; peritoneal EM, n=3) at medium-power magnification (200 x), using the Positive Pixel count v9, ImageScope software, as compared to control endometrium (CE). Data are expressed as mean ± standard deviation. (E) Histogram representing C3 mRNA expression in CE, patient endometrium (PE) and in different EM lesions (peritoneal, deep and ovarian EM). GEP analysis, based on data extracted from GEO (GSE141549), highlighted a significantly higher expression of C3 in EM lesions as compared to CE. ***p < 0.001, ****p < 0.0001 (Mann-Whitney U Test). (F) The gene expression of C3 by EM tissue (n = 5) was investigated by RT-qPCR and compared to normal endometrium (n= 5) using HepG2 hepatocyte cells as calibrator (AU = 1). 18S was used as the housekeeping gene. Data are expressed as mean of at least three independent experiments ± standard error. *p < 0.05 (Mann-Whitney U Test). (G) The C3 mRNA expression was measured by RT-qPCR in EM cells (n= 4) and compared to a normal endometrial cell line, AN3CA. Data are expressed as mean of at least three independent experiments ± standard error. *p < 0.05 (Mann-Whitney U Test). (H) Protein levels of C3 were assessed by ELISA in the supernatant of EM cells (n=4) or AN3CA maintained in culture for 60 h. Data are expressed as mean at least three independent experiments± standard error. (I) The stimulation of AN3CA cells with pro-inflammatory cytokines induced an up-regulation of C3 expression. AN3CA cells were ON stimulated with TNF-α (100 ng/mL) or IL-1β (5 ng/mL) and the C3 expression was analyzed by RT-qPCR. Data are expressed as mean of at least three independent experiments conducted in duplicate ± standard error. *p < 0.05 (Wilcoxon matched pairs test). (J) The expression of C3 was examined in cell lysates by western blot analysis and the intensity of the bands was measured with Odyssey-LICOR scanner. (K) Measurement of C3 protein level by ELISA in AN3CA cell culture supernatant stimulated for 36h with TNF-α (100ng/mL) or IL-1β (5ng/mL). Data are expressed as mean of three independent experiments conducted in duplicate ± standard error. *p < 0.05.

