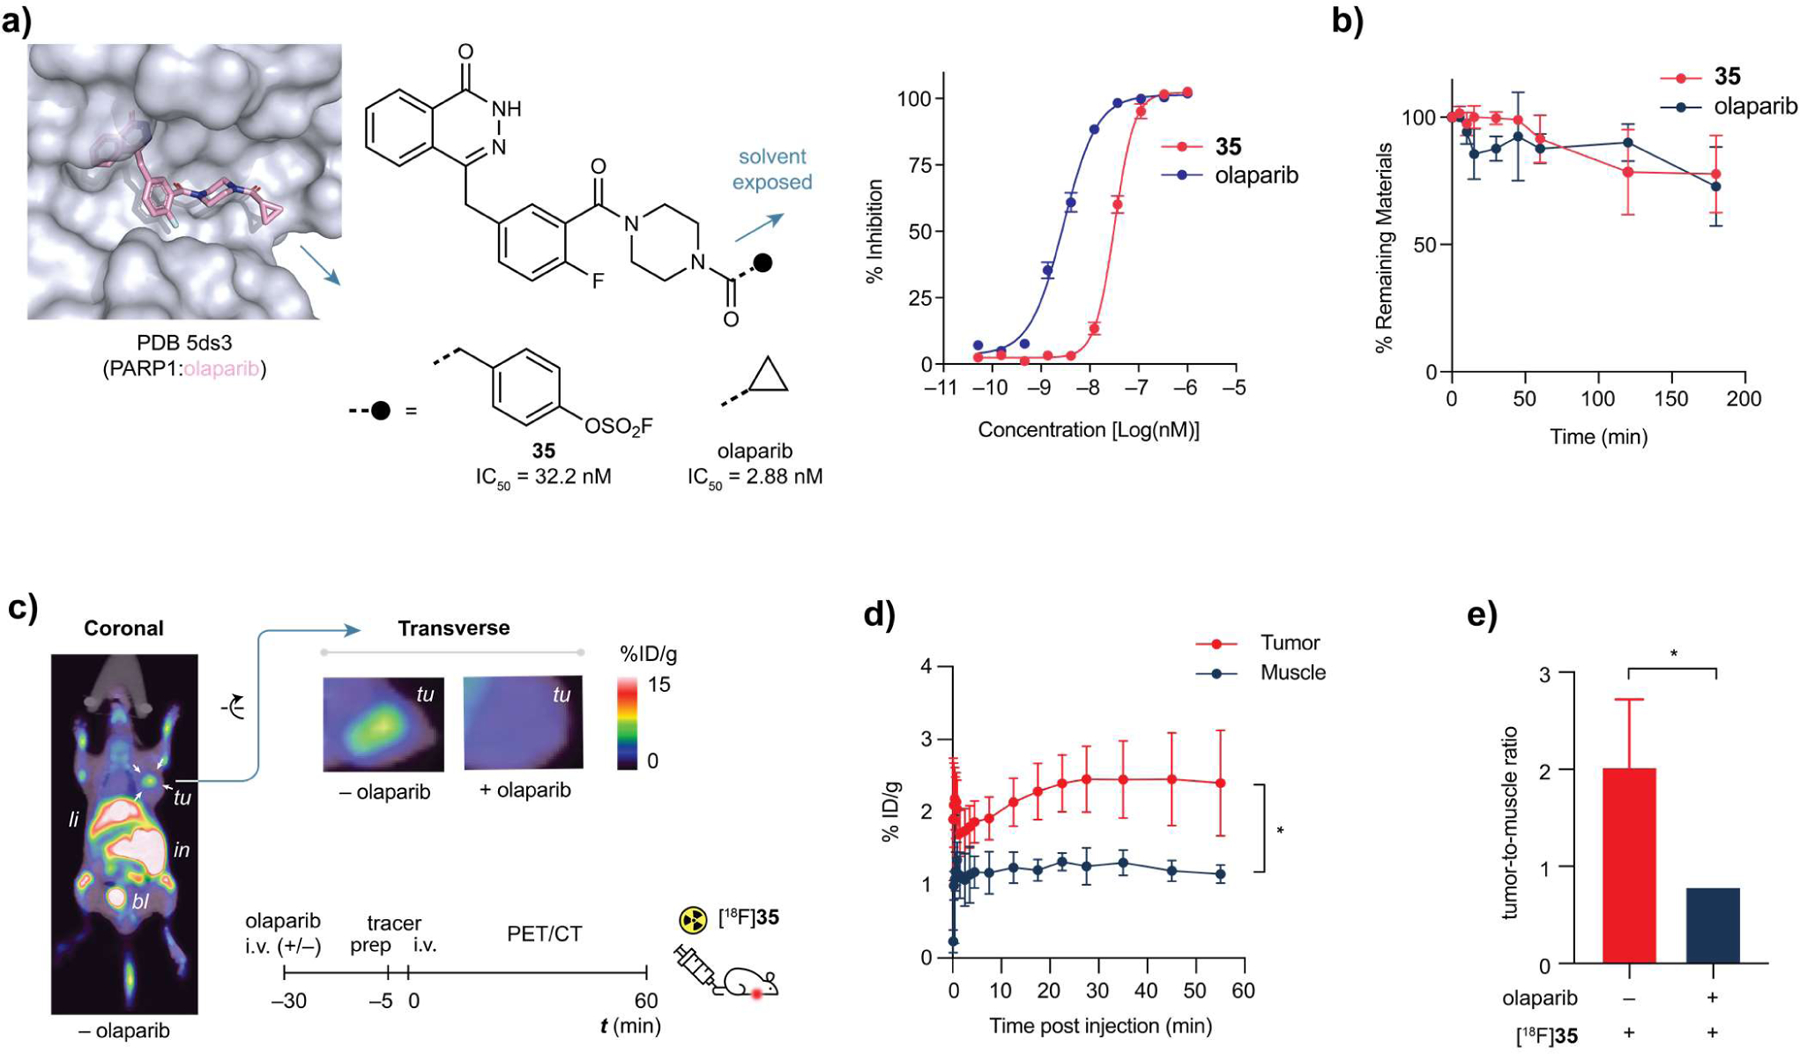
Figure 5.

PET imaging in a tumor xenograft model using [18F]35. (a) Structure-based design of non-covalent PARP1 inhibitor 35 and its dose-response curve, olaparib as positive control. Error bars represent the mean plus standard deviation (SD, n = 3), IC50 = 32.2 nM. (b) Serum stability of 35 is comparable to that of olaparib. (c) Whole body coronal (left), and transverse (top-middle) PET/CT images of human MCF-7 bearing nude mice (transplanted under right shoulder, indicated by white arrows) acquired by performing a 55 min dynamic scan following [18F]35 administration. Transverse PET/CT image (top-right) of mice pre-treated by excess olaparib; No significant uptake of [18F]35 was observed at the tumor site. tu, tumor. li, liver. in, intestine. bl, bladder. (d) Time plot of percentage of injected dose per gram (%ID g−1) of tissue of interest. Error bars represent the mean plus standard deviation (SD, n = 3). P-values were calculated by unpaired Student’s t-test; *P < 0.05. (e) Comparison of pre-treatment with either vehicle (n = 3) or 50 mg kg−1 or olaparib (n = 3) on the %ID g−1 ratio of tumor versus muscle (healthy tissue). P-values were calculated by unpaired Student’s t-test; *P < 0.05.
