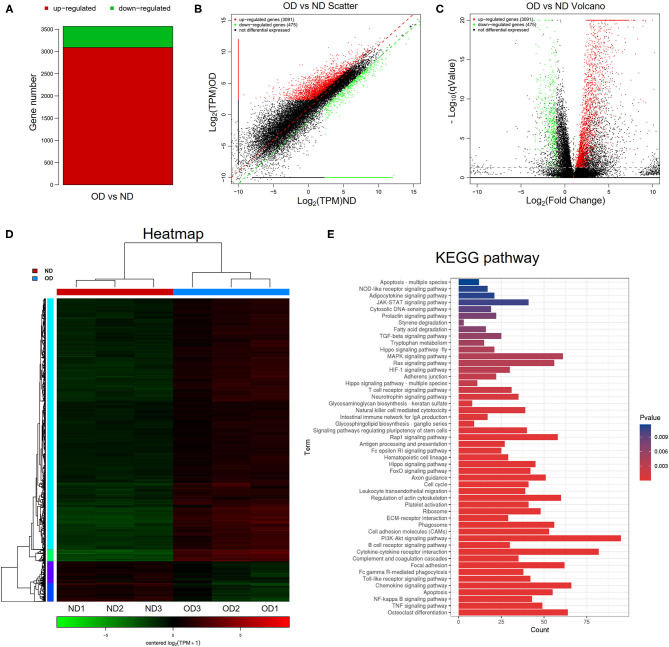
Figure 4.
RNA-seq analysis and KEGG pathway analysis. (A–C) Histogram, scatter plot and volcano plot of DEGs between the OD and ND groups identified by differential expression analysis. (D) Heatmap and hierarchical clustering showing different gene expression patterns between the OD and ND groups. (E) The top 50 enriched KEGG pathways analysis of the identified DEGs.

