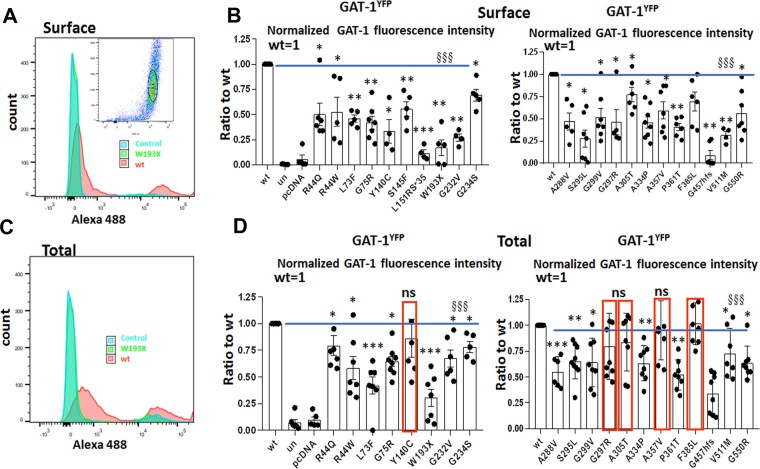
Figure 2.
Altered surface and total expression of variant GAT-1 measured with a high-throughput flow cytometry. (A and C) The flow cytometry histograms depict surface (A) or total (C) expression of the wild-type and the variant GAT-1. HEK293T cells were transfected with the wild-type or the variant GAT-1YFP using 3 µg of cDNAs with polyethylenimine (PEI) at a ratio of 1 µg cDNA to 2.5 µl PEI, with 3 µg cDNAs total. (B and D) The graphs showing the normalized cell surface (B) or total (D) expression of GAT-1YFP from the cells expressing the wild-type or the variant transporters. The relative subunit expression level of GAT-1 in each variant transporter, as well as untransfected (only with PEI) and mock transfected (pcDNA), was normalized to that obtained from cells with transfection of the wild-type. In D, red boxed variants were not different from the wild-type. n = 4–7 different transfections, §§§P < 0.001 overall variations versus wild-type, *P < 0.05, **P < 0.01, ***P < 0.001 versus wild-type, one-way ANOVA and Newman-Keuls test. Values are expressed as mean ± SEM.

