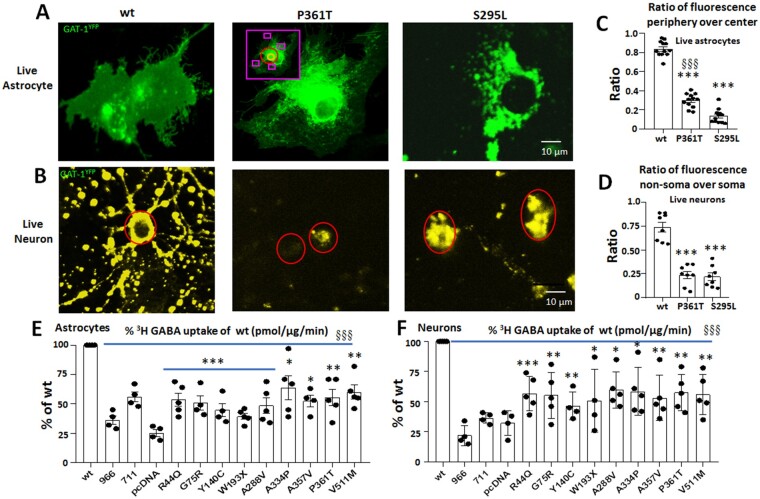
Figure 3.
Reduced function of variant GAT-1 in live mouse cortical astrocytes and neurons. Mouse cortical neurons were cultured from postnatal Day 0 pups, while cortical astrocytes were cultured from postnatal Day 0–3 pups. (A) Astrocytes (passage 2) were transfected with the wild-type GAT-1YFP, GAT-1(P361T)YFP or GAT-1(S295L)YFP with PEI and harvested at 48 h after transfection. (B) Neurons were transfected for the same conditions at Day 5–7 in culture with a calcium precipitation method and harvested for experiments at Day 15 in dish. The images show two representative variants (P361T) and (S295L) in live astrocytes (A) or in live neurons (B). (C and D) The GAT-1YFP fluorescence in different subcellular compartments was quantified by MetaMorph®. (C) The GAT-1YFP fluorescence in astrocytes was measured at the peripheral and central regions, as illustrated in the inset in the middle panel of A. The purple rectangle represents the peripheral region, the red circle represents the middle region, and the orange circle represents nuclei region, which was taken as background signal (n = 12 cells from four batches of cells). (D) The ratio of GAT-1YFP fluorescence in dendrites versus soma was measured by sampling the region of somatic versus non-somatic region (n = 8 fields from three batches of cells). (E and F) Neurons or astrocytes were prepared in 35 mm dishes, and the GABA uptake function was evaluated with 3H radiolabelling. The graph represents the relative activity of GABA uptake in mouse cortical astrocytes (E) or cortical neurons (F). In C–F, ***P < 0.001 versus wild-type, in C, §§§P < 0.001 versus S295L. In E and F, n = 4–5 transfections, §§§P < 0.001 overall variants versus wild-type, *P < 0.05, **P < 0.01. One-way ANOVA and Newman-Keuls test was used to determine significance compared to the wild-type condition and between variations. Values are expressed as mean ± SEM.

