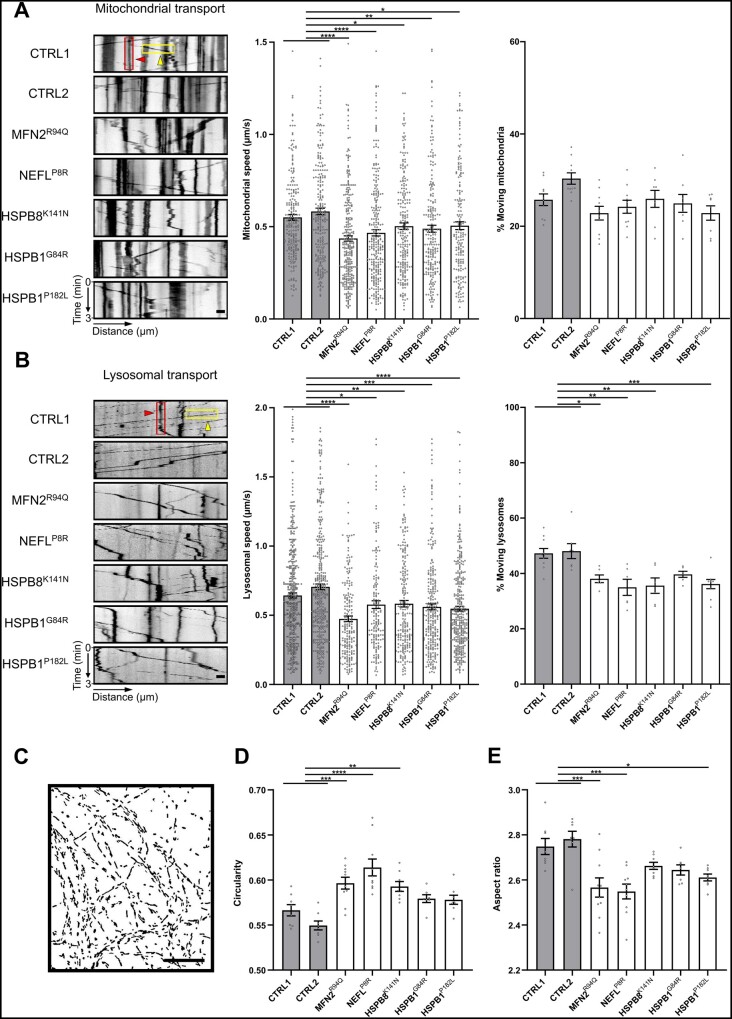
Figure 3.
CMT2-derived motor neurons cause axonal transport deficits and altered mitochondrial morphology. (A) Mitochondrial transport analysis at Days 38–50 using kymographs (left). Quantification of mitochondrial speed (n = 182–295) and percentage of moving mitochondria (n = 8–11) was performed after MitoTrackerTM labelling and imaging for 3 min. (B) Lysosomal transport analysis at Days 38–50 using kymographs (left). Quantification of lysosomal speed (n = 161–433) and percentage of moving lysosomes (n = 6–10) was performed after LysoTrackerTM labelling and imaging for 3 min. (A and B) Examples of representative kymographs showing moving (yellow boxes and arrowheads) and stationary (red boxes and arrowheads) organelles. Dots represent either individual organelles (speed) or the average value of the kymographs per recording (% moving) (data pooled from two independent differentiations; mean ± SEM). (C) Representative fluorescence mask (MitoTrackerTM) used to study the mitochondrial shape. (D and E) Quantification of mitochondrial circularity and aspect ratio. Data-points represent the average values for the mitochondria present in the image (n = 8–10; data pooled from two independent differentiations; mean ± SEM). Statistical significance to evaluate speed was calculated using one-way ANOVA followed by Dunnett’s multiple comparisons test, while Kruskal-Wallis test with Dunn’s multiple comparison was used to perform statistics on the percentage of moving organelles and mitochondrial morphology (*P < 0.05, **P < 0.01, ***P < 0.001, ****P < 0.0001). Scale bar = 20 µm.

