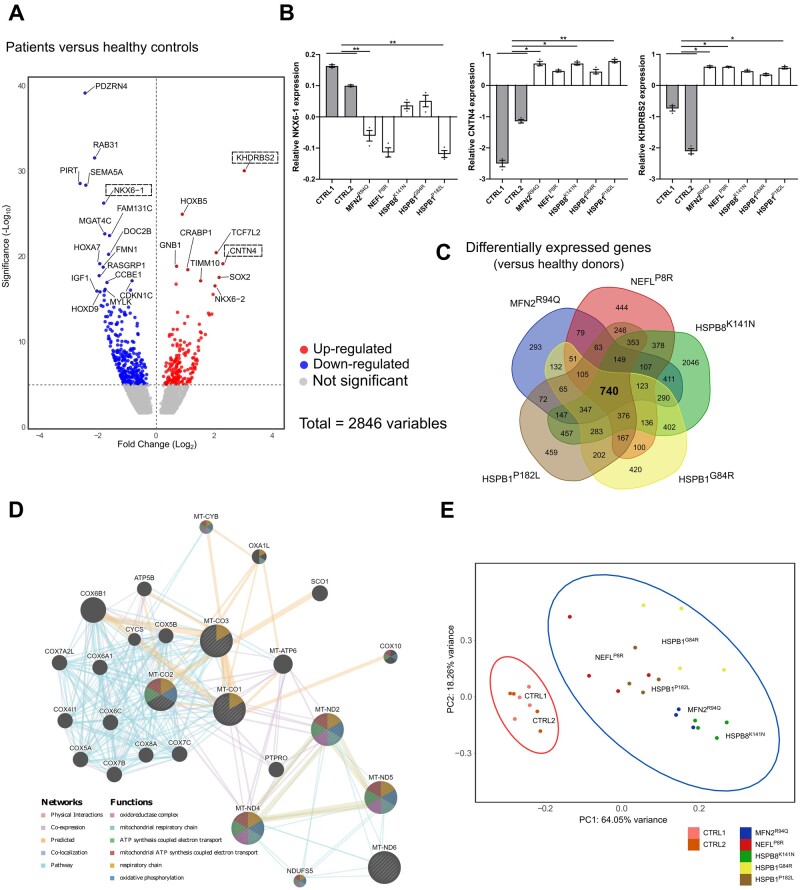
Figure 5.
Transcriptional profile of CMT2 iPSC-derived motor neurons at Day 50. (A) Volcano plot of log2 fold change versus mean comparing the control lines with the patients. Boxes are used to indicate genes that were validated using RT-qPCR. (B) RT-qPCR to confirm the relative expression of differentially expressed genes (DEGs) in iPSC-derived neurons at Day 50 (n = 3; data pooled from two independent differentiations; mean ± SEM). (C) Venn-diagram of the DEGs of CMT2 models compared with healthy donors. (D) Network analysis of the DEGs responsible for the top terms shown in Cellular Component terms. (E) PCA of all mitochondrial coded genes in healthy control and patient samples. Statistical significance of RT-qPCR results was calculated using one-way ANOVA followed by Dunnett’s multiple comparisons test (*P < 0.05, **P < 0.01, ***P < 0.001, ****P < 0.0001).

