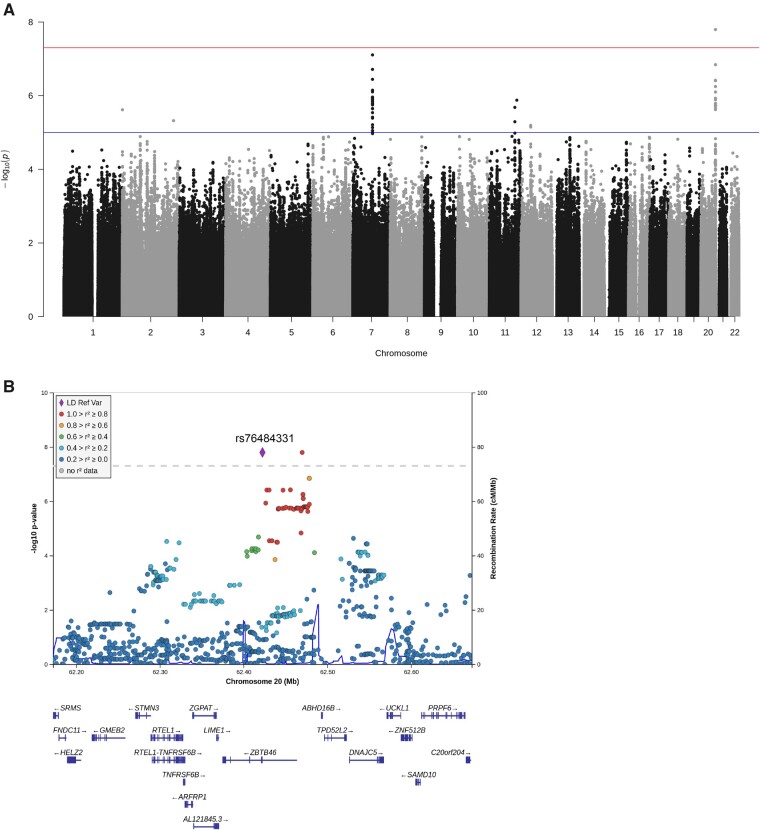
Figure 1.
Genome-wide association meta-analysis of parenchymal haematoma. SNPs were represented by dots and were plotted based on their GWAS meta-analysis P-values. (A) Manhattan plot of genome-wide association meta-analysis. The red line shows genome-wide significance (P < 5 × 10⁻⁸) and the blue line represents the suggestive association significance threshold (P < 1 × 10⁻⁵). Results were adjusted for age, sex, baseline NIHSS, diabetes, and principal components. (B) Regional association plot centred on rs76484331 (ZBTB46). The regional plot was drawn using LocusZoom software v0.4.8. Linkage disequilibrium with the top SNP is represented by the coloured dots. Genes were characterized by horizontal lines. The ZNF512B gene was omitted.

