Figure 2.
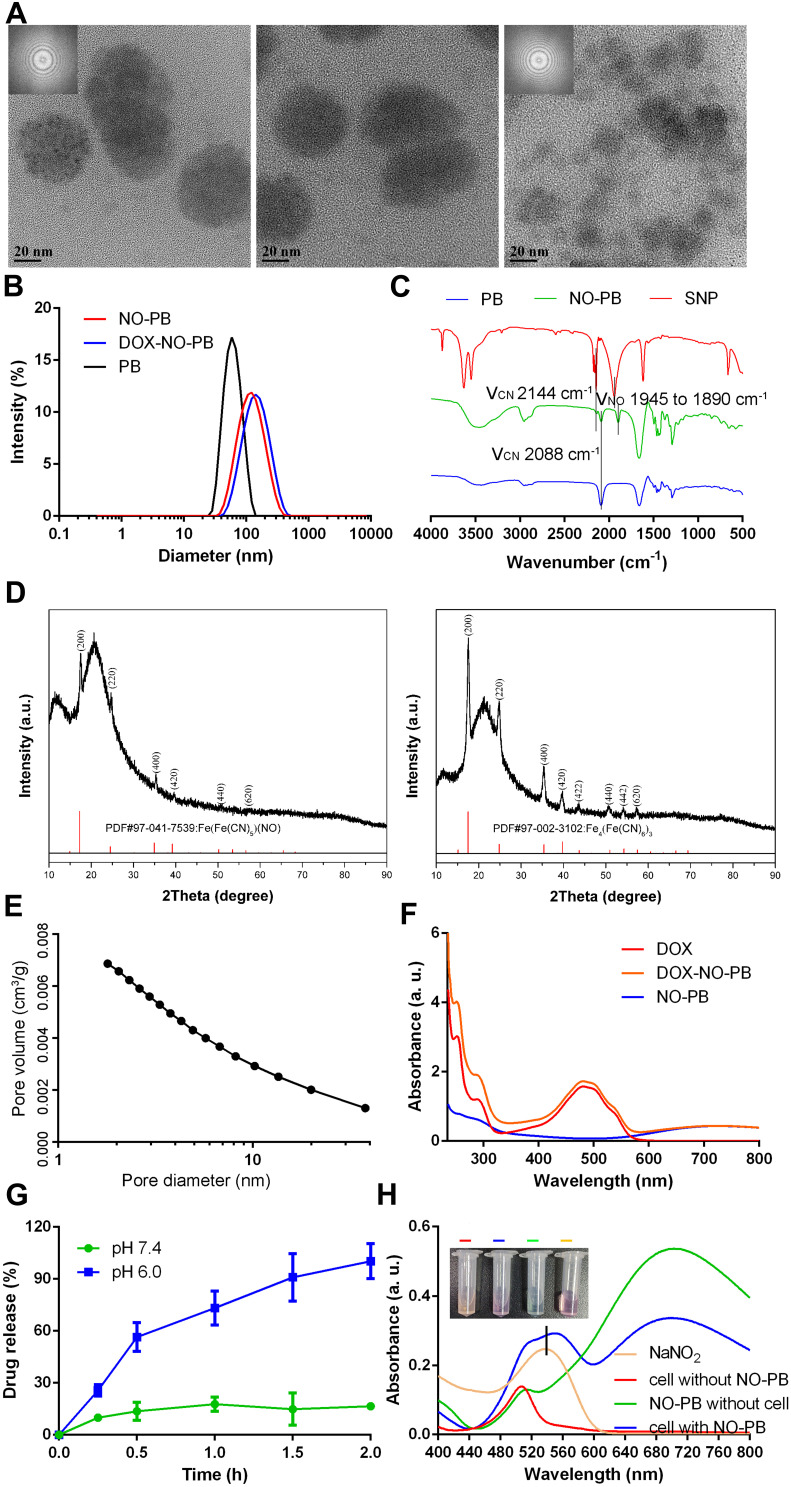
The physical and chemical properties of nanoparticles. (A) The TEM and SAED (insert) images of NO-PB (left), DOX-NO-PB (middle) and PB (right) (the scale bar represents 20 nm); (B) the particle sizes of NO-PB, DOX-NO-PB and PB measured by the DLS method; (C) the IR spectrum of NO-PB, PB and SNP; (D) the XRD spectrum of NO-PB (left) and PB (right); (E) the BJH adsorption cumulative pore volume profile of NO-PB; (F) the UV spectrum of free DOX, NO-PB and DOX-NO-PB; (G) the DOX release profiles of DOX-NO-PB in the buffers with pH values of 7.4 and 6.0 (n = 3); (H) the NO generation detected by the Griess reagent.

