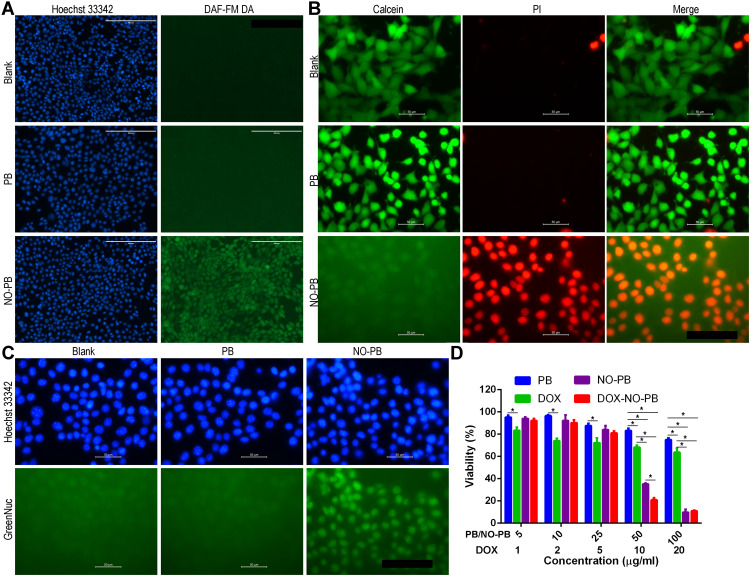
Figure 3.
The NO production capacity and anti-tumor effect of nanoparticles in 4T1 cells. (A) The NO generation in the 4T1 cells detected by the fluorescence probe DAF-FM DA (the scale bar represents 200 µm); (B) the live-dead assay by the Calcein/PI kit (the scale bar represents 100 µm); (C) the caspase 3 activation in the 4T1 cells by the GreenNuc kit (the scale bar represents 100 µm); (D) the cell viability measured by the MTT test, *Represents statistically significant (p < 0.05, n = 6).

