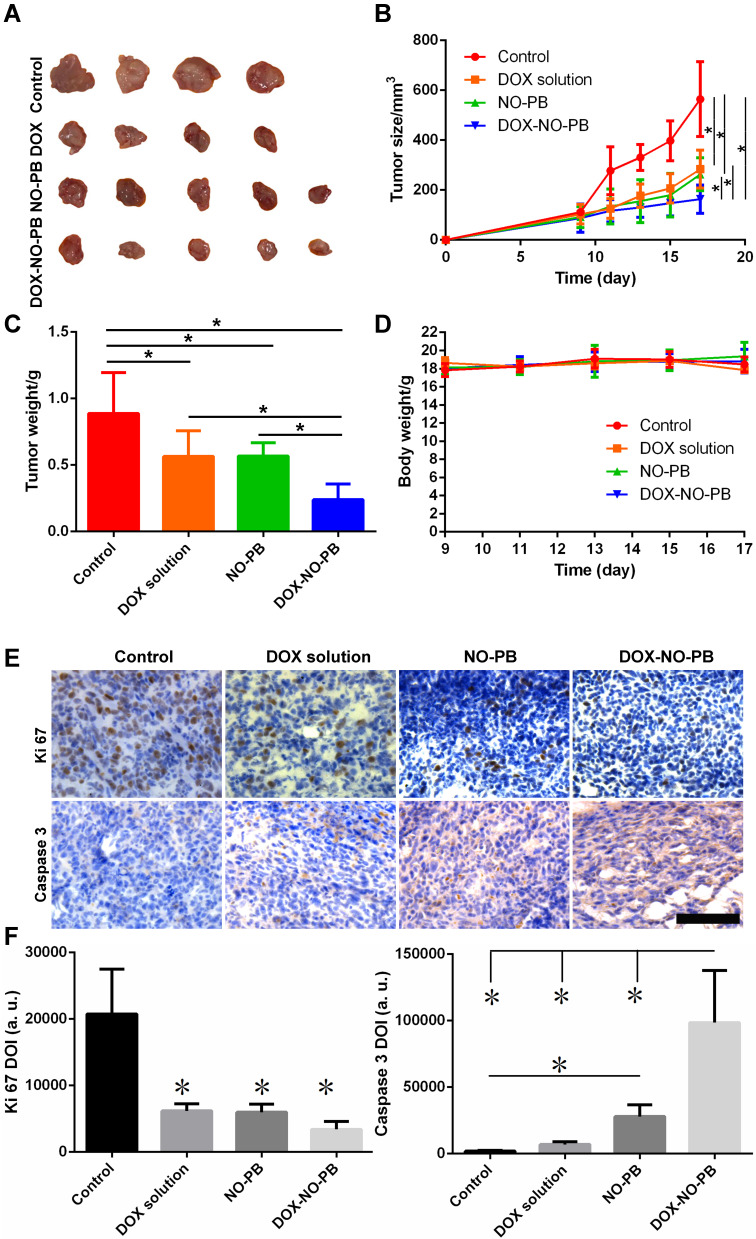
Figure 5.
The anti-tumor effects of nanoparticles in 4T1 tumor bearing mice. 4T1 tumor bearing mice were administrated with PBS (as control), free DOX (250 µg/mouse), NO-PB (50 µg/mouse) or DOX-NO-PB (containing 50 µg NO-PB and 250 µg/mouse). (A) The picture of the tumor samples (__ represents 1 cm); (B) the tumor growth profiles throughout the whole experiment, *Represents statistical difference (p < 0.05, n = 5); (C) the tumor weights at the end of the experiment, *Represents statistical difference (p < 0.05, n = 5); (D) the body weight changes of the mice throughout the experiment (n = 5); (E) the IHC images of the cleaved caspase 3 and Ki 67 expression in the tumor tissues (the scale bar represents 100 µm); (F) the quantitative analysis of the Ki67 and the cleaved caspase 3 expression, *Represents statistical difference (p < 0.05, n = 5).

