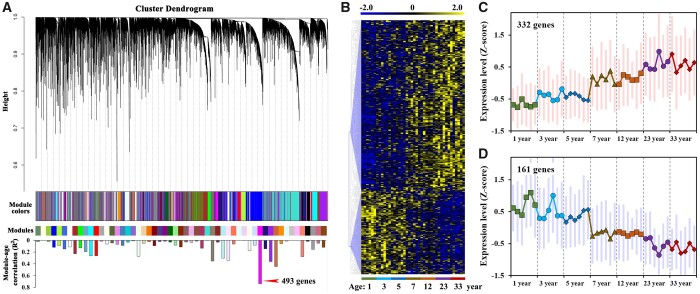
Figure 1.
WGCNA and expression patterns of differentially expressed genes from seven different ages. A, WGCNA was conducted on a total of 13,607 genes that were differentially expressed between any two sample groups of the seven different age stages (P < 0.01). Six biological replicates (trees) were sequenced for each age group. Based on topological overlap, a cluster dendrogram was produced using gene average linkage hierarchical clustering. Modules of coexpressed genes are shown with different color bars beneath the dendrograms. B, Heatmap of 493 differentially expressed genes that were significantly correlated with age. C, Expression profiles of genes that were upregulated with age. D, Expression patterns of genes that were downregulated with age. The pointes with same shape and color indicate samples in same age group. Each age group represent by six biological replicates (six different trees). The red and blue shading in (C) and (D) represents the maximum and minimum values of all genes in each sample.

