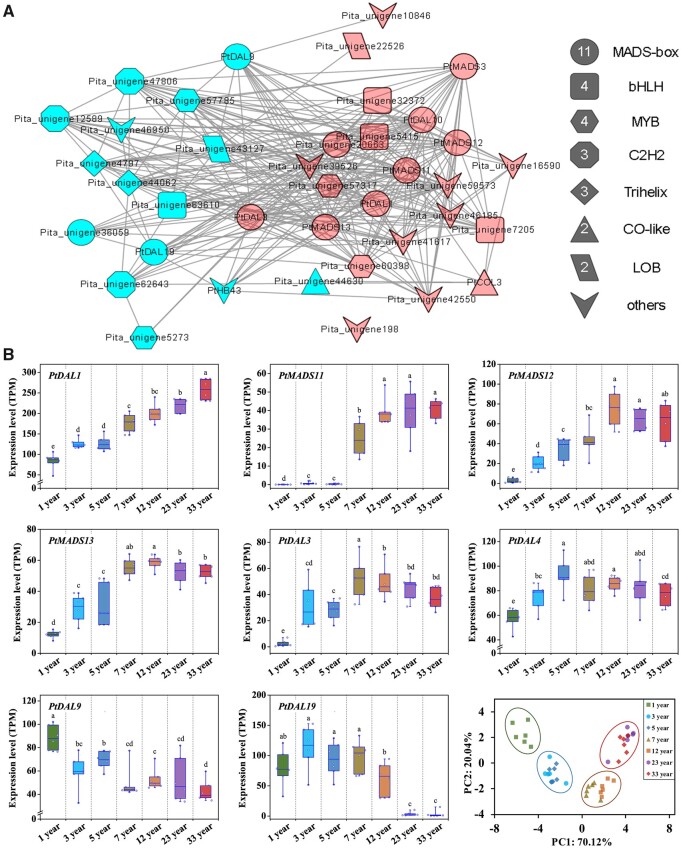
Figure 2.
MADS-box TFs are enriched among differentially expressed genes associated with age in P. tabuliformis. The coexpression network of 33 tightly integrated TFs. The red shapes represent the genes with expression increase with age, and the blue shapes represent a decrease. B, Expression pattern analysis of PtDAL1 and seven SOC1-like genes in different age groups and PCA for different age groups. The box lower and upper boundaries indicate the 25th and 75th percentiles for each data set. The horizontal lines inside the boxes represent the median values. Whiskers indicate the maximum and minimum values. Different lowercase letters above the plots indicate significant differences at the 0.05 level (ANOVA multiple range test), n = 6.

