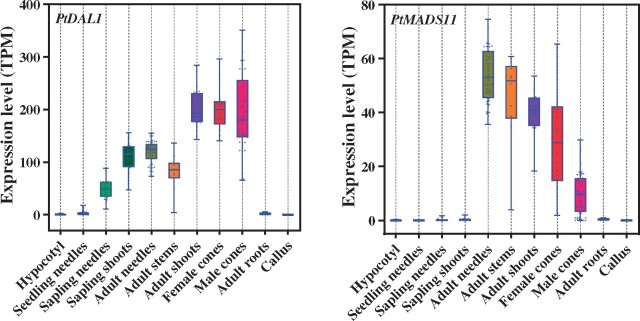
Figure 3.
PtDAL1 and PtMADS11 expression profiles in various tissues of P. tabuliformis. The expression levels of PtDAL1 and PtMADS11 in 347 total samples of P. tabuliformis were analyzed through RNA-seq, including samples of the hypocotyl (2 months of age, n = 36), seedling needles (2 months of age, n = 90), sapling needles (3–5 years of age, n = 18), sapling shoots (3–5 years of age, n = 18), adult needles (33 years of age, n = 48), adult stems (33 years of age, n = 10), adult shoots (22–33 years of age, n = 30), female cones (33 years of age, n = 18), male cones (33 years of age, n = 57), adult roots (33 years of age, n = 4), and callus (induced from the cotyledon, n = 18). The lower box and upper boundaries indicate the 25th and 75th percentiles for each data set. The horizontal lines inside the boxes represent the median values. Whiskers indicate the maximum and minimum values.

