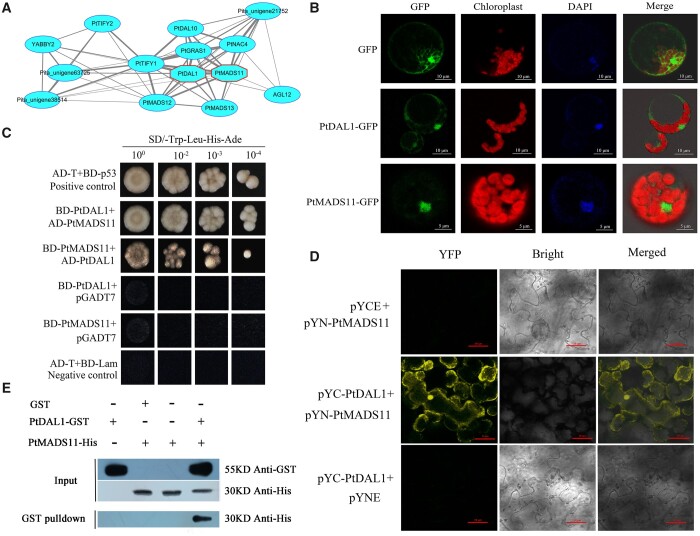
Figure 5.
PtMADS11 physically interacts with PtDAL1. A, TFCN based on the SCCM among age-related MADS-box TFs. The red octagons indicate the PtDAL1 and PtMADS11. B, Subcellular localization analysis of PtDAL1 and PtMADS11 performed in Arabidopsis protoplasts. Scale bars: 10 μm (upper two rows) and 5 μm (bottom row). C, Y2H assay of interactions between PtDAL1 and PtMADS11. AD-T and BD-p53 were used as positive control; AD-T and BD-Lam were used as negative control. D, BiFC assay of interactions between PtDAL1 and PtMADS11 in N. benthamiana leaf epidermis. YFP, YFP fluorescence; Bright, bright field image; Merge, merged image of YFP and Bright; pYN-PtMADS11, expression of pYN-PtMADS11 alone; pYC-PtDAL1, expression of pYC-PtDAL1 alone; pYN-PtMADS11+pYC-PtDAL1, coexpression of pYN-PtMADS11 and pYC-PtDAL1. Scale bars: 20 μm. E, GST pull-down analysis of the protein interaction between PtDAL1 and PtMADS11.

