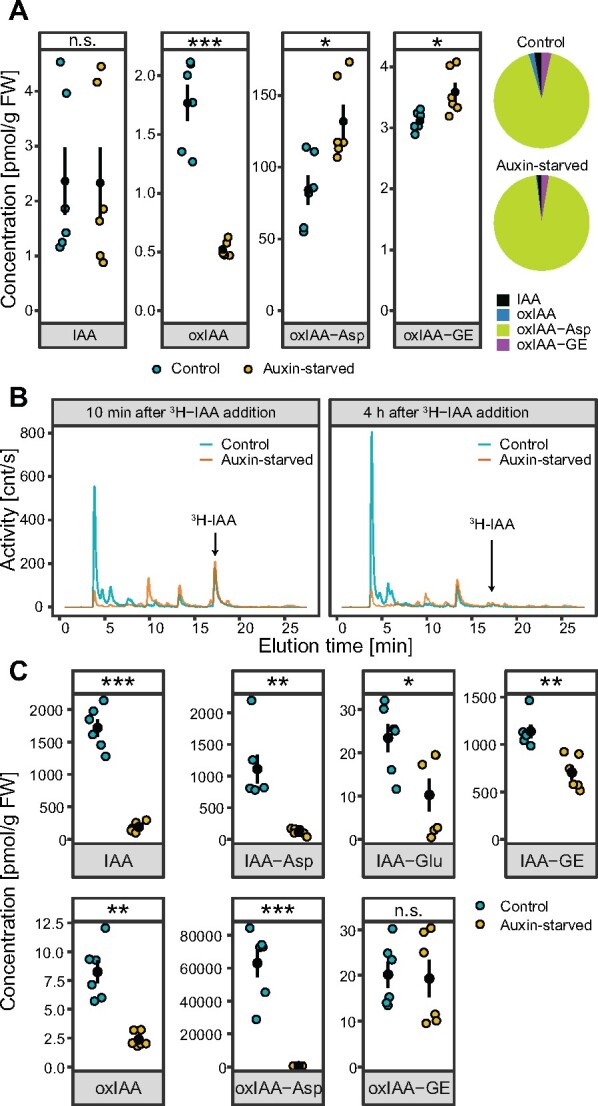
Figure 2.

Distinct auxin metabolism in 2,4-D-supplemented and auxin-starved BY-2 tobacco cell cultures. A, The endogenous contents of free IAA and its metabolites were measured in 2-d-old control (2,4-D-supplemented) and auxin-free-cultivated BY-2 cell culture. Data points and error bars indicating mean ± SE are shown. Pie charts represent relative contributions of detected metabolites to the overall content of auxin in the cells. B, Auxin metabolite profiling of control and auxin-starved cells performed by HPLC chromatography 10 min and 4 h after application of 3H-IAA into the media. C, Mass-spectrometry-based quantification of free IAA and its metabolites in control and auxin-starved cells 2 h after application of 1 µM IAA into the media. Data points and error bars indicating mean ± SE are shown. A and C, Student’s t test P-values: *P < 0.05, **P < 0.01, ***P < 0.001.
