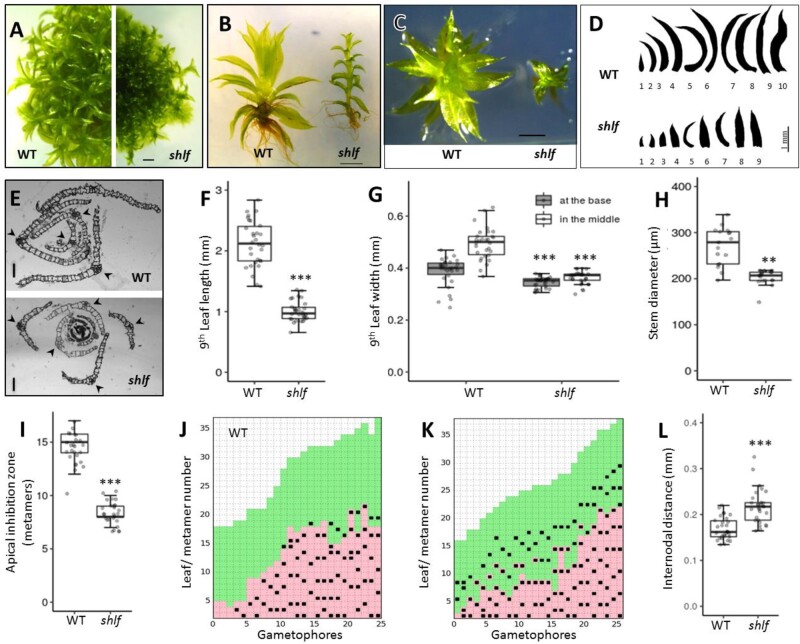
Figure 1.
Short-leaf (shlf) mutant exhibits pleiotropic phenotypes and suppressed growth of gametophores. A–D, Comparison of 3 weeks old WT and shlf colonies (A), gametophores (B and C), and leaf arrays (D). Scale bars, 1 mm. E, Transverse sections of WT and shlf gametophore apices showing the difference in the number of leaf blade cells. Arrow head marks the midrib flanked by single cell-layered leaf blades. Scale bars, 50 µm. F–H, WT and shlf 9th leaf length (n = 30) (F), width at the base as well as at the middle of medio-lateral axis (n = 30) (G) and stem diameter (n = 3) (H) were analyzed. I, The number of metamers from the apex till the first branch is known as apical inhibition zone (n = 26) was analyzed. J and K, Hinton diagram showing differences in the branching pattern between WT (J) and shlf (K) gametophores. The lowest and highest metamer numbers represent the base and the apex of the gametophore, respectively. Each branch/branch initial is marked as a black square. The young leaves are marked as green box and mature leaves with rhizoids are marked as pink box. L, The internodal distance (n = 30) of WT and shlf gametophores was also analyzed. All statistical analysis were performed using Mann–Whitney Wilcox test and P-value <0.001 and <0.0001 were marked as ** and ***, respectively.

