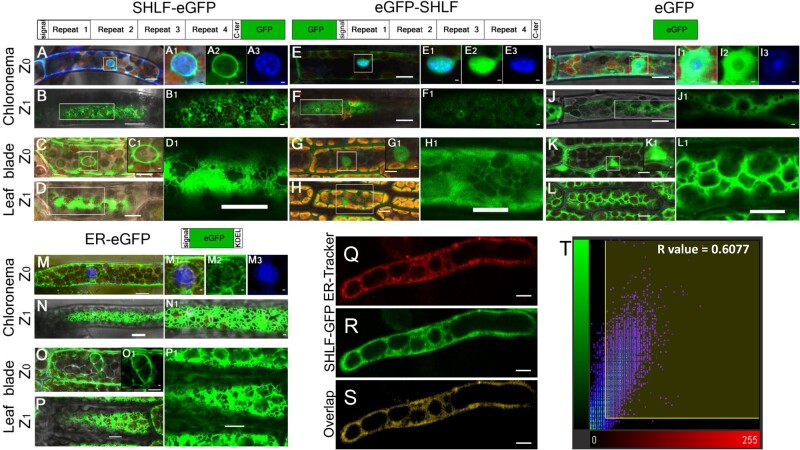
Figure 6.
SHLF protein has a conserved signal peptide and traffics to ER in moss. A, C, M, and O, In tissue types, such as chloronema and leaf blade cells, at Z0 (optical plane bisecting the nucleus), the C-terminal GFP fusion line (SHLF-eGFP) (A and C) and ER marker line show GFP signal along with the nuclear membrane (M and O). E, G, I, and K, However, both N-terminal (eGFP-SHLF) eGFP fusion line (E and G) and eGFP line (I and K) show GFP signal in cytoplasm and inside the nucleus. The magnified view of the nucleus is a merged (A1, C1, E1, G1, M1, I1, and K1) image of eGFP (A2, E2, I2, and M2) and DAPI (A3, E3, I3, and M3) signals shown in green and blue colors, respectively. B, D, N, and P, Similarly at Z1 (optical section underneath the plasma membrane), C-terminal GFP fusion line (SHLF-eGFP) (B and D) and ER marker line (N and P) showed GFP signal in the cortical ER. F, H, J, and L, Both N-terminal eGFP fusion line (eGFP-SHLF) (F and H) and eGFP line (J and L) show GFP signal in cytoplasm and inside the nucleus. Insets are magnified images for better visualization. Q–S, Co-localization of ER-Tracker dye (Q) and SHLF-eGFP (R) signals depicted in the overlap (S) in protonemal cells (scale bar = 10 μm). T, Scatter plot showing the co-localization of the ER-Tracker and SHLF-eGFP signals with a Pearson’s coefficient of 0.6077. All scale bars represent 10 µm. The scale bars in the insets represent 1 µm except D1, H1, and L1 which are of 10 µm.

