
Figure 3.
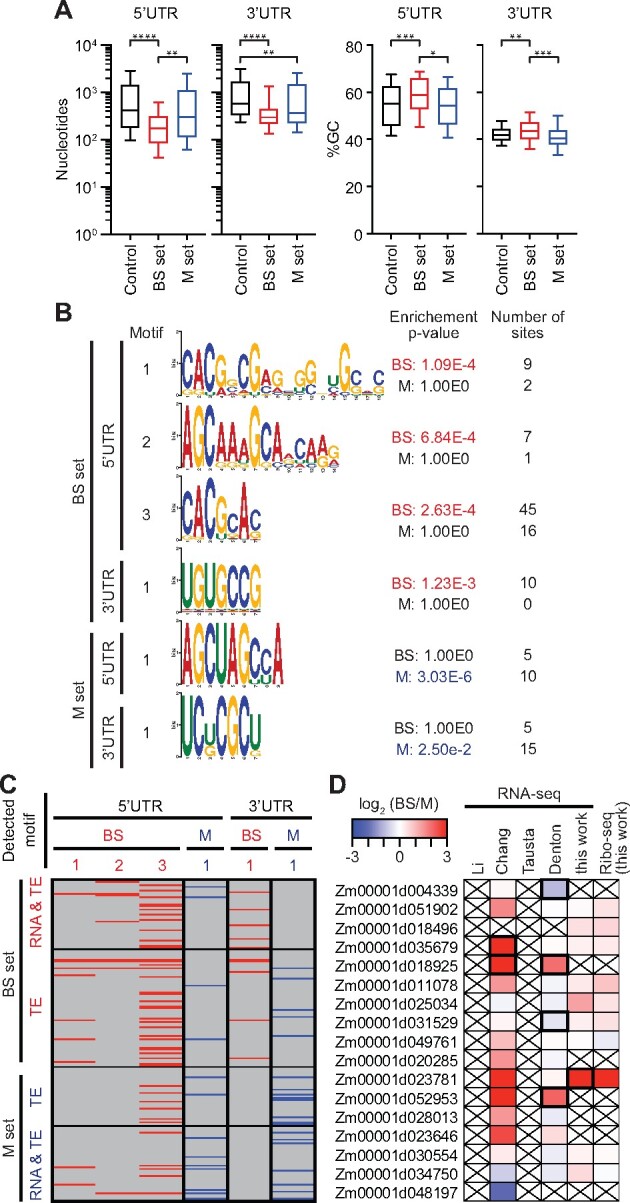
Characteristics of UTRs of differentially translated genes. Differentially translated genes used for these analyses are the TE and RNA&TE sets from Figure 2B (|log2(BS/M TE)| > 1.585, FDR < 0.001 excluding buffering sets, BS set n = 107 and M set n = 75). The control set was defined as |log2 (BS/M) TE| ≤ 0.585 (n = 5280). A, UTR length and GC content. Horizontal lines show median values, boxes show 25–75th percentile, and whiskers indicate 10–90th percentiles. Brackets show significant P-values from Dunn’s multiple comparison test of the means. *P = 0.01; **P < 0.005; ***P = 0.002, and ****P < 0.0001. B, Enriched motifs in UTRs of differentially translated genes. Enriched motifs in the data set indicated to the left were identified with STREME (Bailey, 2021) and those matching known DNA motifs were removed. Motifs reported by AME (McLeay and Bailey, 2010) as significantly enriched (P < 0.05) are shown in red or blue font. The enrichment P-values and number of sites for the nonenriched data are shown for comparison. C, Presence of enriched motifs in differentially translated genes. Gene sets are taken from Figure 2B. Motifs are identified at top via the motif numbers shown in (B). D, Differential expression of PUF genes. Values from prior RNA-seq datasets come from Li et al. (2010), Chang et al. (2012), Tausta et al. (2014) section 14, and Denton et al. (2017) section S1. Genes reported with high confidence as differentially expressed in prior studies or in our data [|log2(BS/M)| > 1, FDR < 0.001] are bordered in black. Crossed boxes indicate absence of data or read counts below cutoffs.