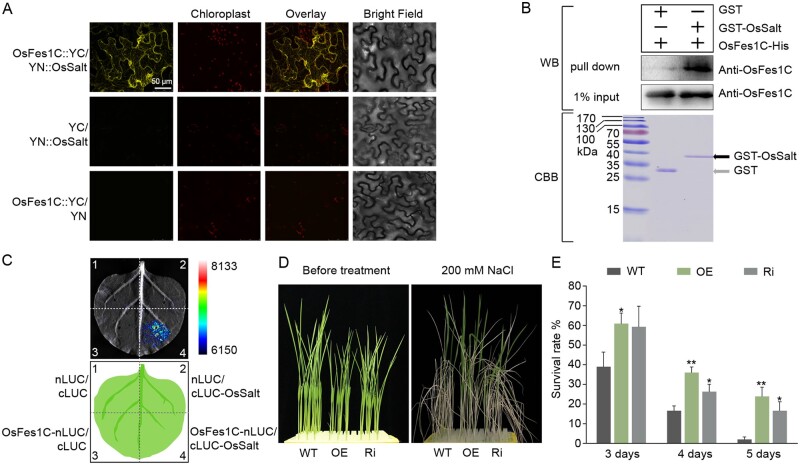
Figure 6.
OsFes1C is involved in salt response. A, The interaction between OsFes1C and OsSalt in plant cells was confirmed by BiFC. The scale bar (50 μm) for the top left image apply to all images. B, The GST pull-down assay shows that the OsFes1C-His was pulled down only with GST-OsSalt, but not with the GST control. C, LCI assay for interaction between OsFes1C-nLUC and cLUC-OsSalt in N. benthamiana. D, More transgenic seedlings survived than WT under the NaCl treatment condition. E, Quantitative measurements of the survived WT and transgenic seedlings after treatment with NaCl for 3–5 d. All data are averages of three independent experiments, and error bars represent sem. *P < 0.05, **P < 0.01 (Student’s t test).

