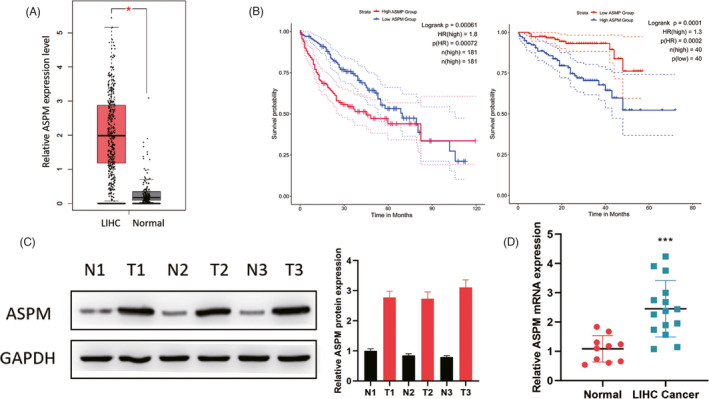
FIGURE 1.

High ASPM expression in LIHC. (A) GEPIA2 database was performed to analyze the ASPM expression levels in LIHC. (B) Kaplan‐Meier survival curves of OS based on ASPM mRNA expression in LIHC patients. The data were analyzed in TCGA(left) and ICGC(right) database. ASPM protein and mRNA expression in LIHC tissues and corresponding normal tissues were measured by Western blotting (C) and qPCR (D). *p < 0.05, ***p < 0.001. Data represent at least three independent sets of experiment
