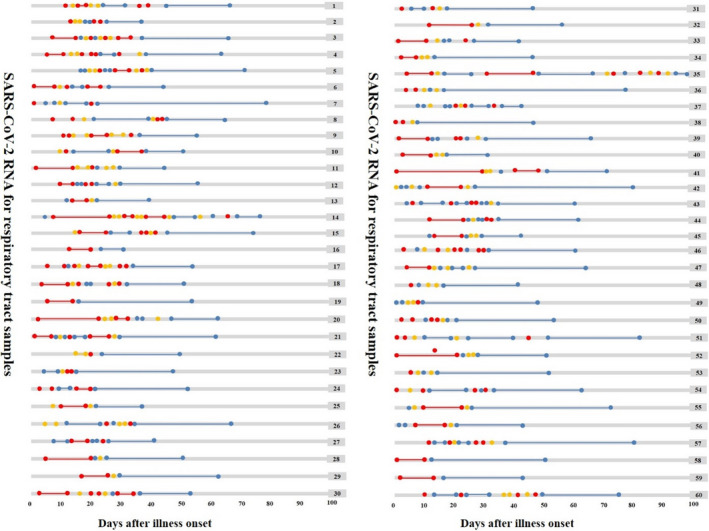
FIGURE 1.

Dynamic changes in SARS‐CoV‐2 RNA for respiratory tract samples since illness onset. SARS‐CoV‐2 negative results are represented by blue dots, invalid results by yellow dots, and positive results are in red dots, plotted on a time scale from the date of the first test since illness onset
