FIGURE 5.

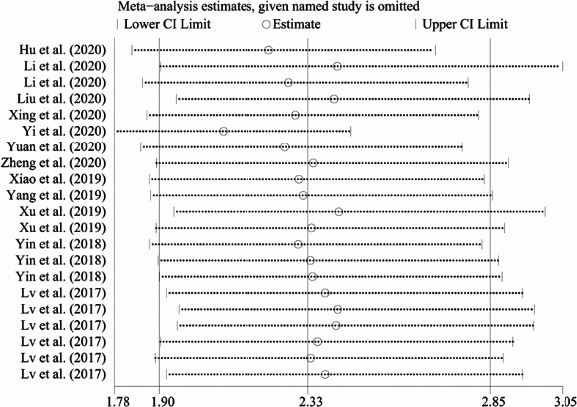
Sensitivity analysis to assess the stability results. Sensitivity analysis was performed by omitting each study one by one, and the omitted studies were shown on the left side of the graphics

Sensitivity analysis to assess the stability results. Sensitivity analysis was performed by omitting each study one by one, and the omitted studies were shown on the left side of the graphics