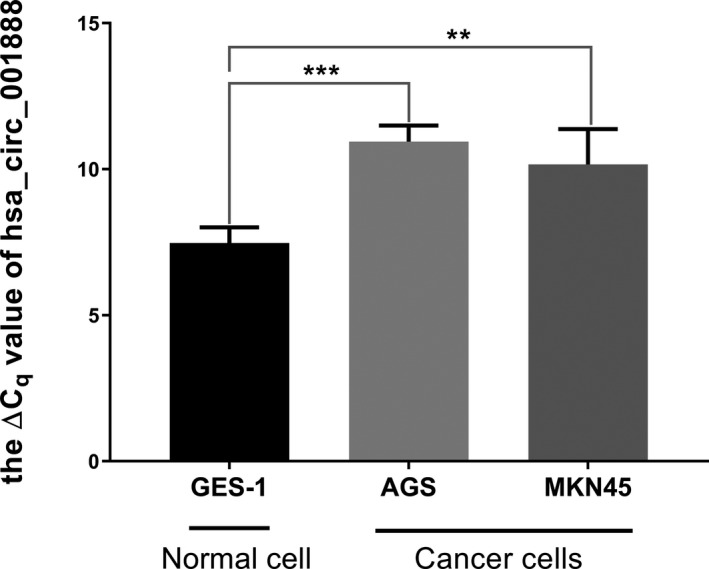
FIGURE 2.

The relative expression of hsa_circ_001888 in gastric cancer cell lines. Hsa_circ_001888 expression levels in two human gastric cancer lines (AGS and MKN‐45) and normal gastric mucosa epithelial cell line (GES‐1) were determined by qRT‐PCR. Data are expressed as mean ± SD of three independent experiments. ** means p < 0.01, *** means p < 0.001
