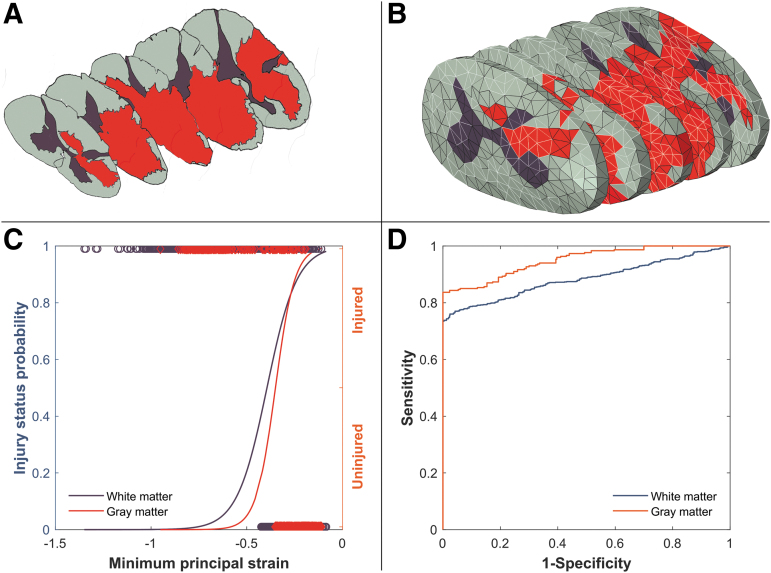
FIG. 8.
Example logistic analysis (minimum principal logarithmic strain [min LEP] in subject #6 in this case) on a randomly selected element set. (A) histology slides (white matter in gray, gray matter in brown, and injured tissue in red) stacked in isometric view showing epicenter, ±1.6 mm and ±3.2 rostral with corresponding (B) FE slices at approximately the same anatomical position. Random sets of elements were selected for white and gray matters from all the five slices (elements with light border) comprising approximately the same number of injured and uninjured elements for each set. (C) The peak min LEP experienced by the elements in the element set were plotted against binary status of the element, and a logit regression curve was fitted. In this case, the fit was statistically significant with p < 0.0001 for both gray and white matters, and the Nagelkerke R-square was 0.66 ± 0.04 and 0.36 ± 0.02 for gray and white matters, respectively. (D) Receiver operating characteristic (ROC) curve is higher for the gray matter (is more distanced from the diagonal line) therefore, min LEP has better predictive power for gray matter tissue damage compared with the white matter ROC curve. This is confirmed with area under the curve values equal to 0.95 and 0.88 for gray and white matters, respectively.

