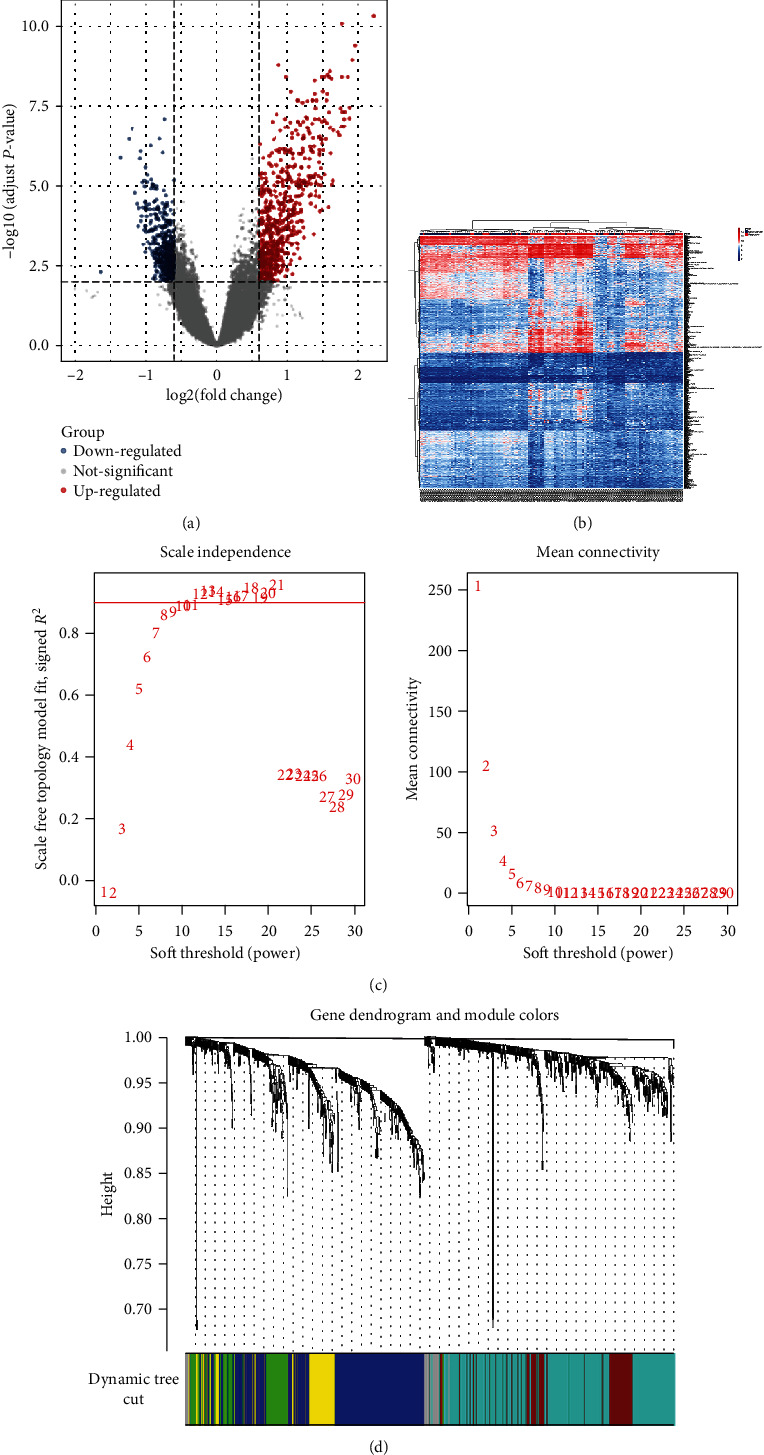
Figure 1.

WGCNA of DEGs in AMI. (a) Volcano plots of DEGs. (b) AMI DEGs visualized using a heatmap. (c) Soft thresholding power analysis allowed for provision of scale-free fit index of network topology. (d) Coexpression clusters were conducted with hierarchical cluster analysis with corresponding color assignments encoded using WGCNA.
