
Figure 4.
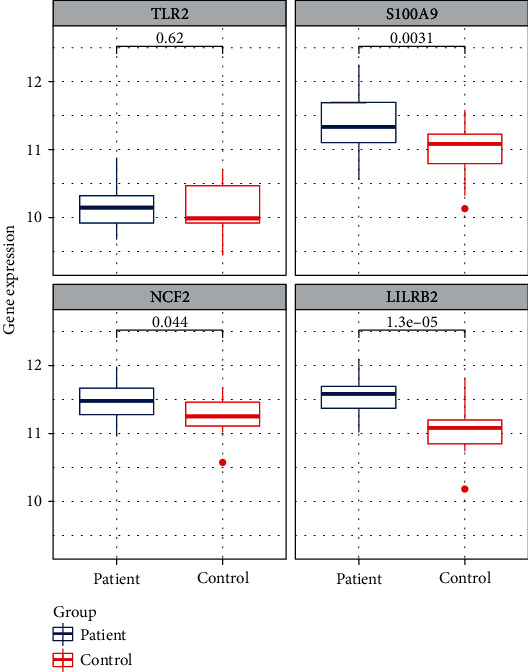
Contrast of the expression change of TLR2, S100A9, NCF2, and LILRB2 in the GSE62646 dataset. The box plots represent the results from the AMI group and control group. P values are shown above each box plot.
Official websites use .gov
A
.gov website belongs to an official
government organization in the United States.
Secure .gov websites use HTTPS
A lock (
) or https:// means you've safely
connected to the .gov website. Share sensitive
information only on official, secure websites.
Contrast of the expression change of TLR2, S100A9, NCF2, and LILRB2 in the GSE62646 dataset. The box plots represent the results from the AMI group and control group. P values are shown above each box plot.