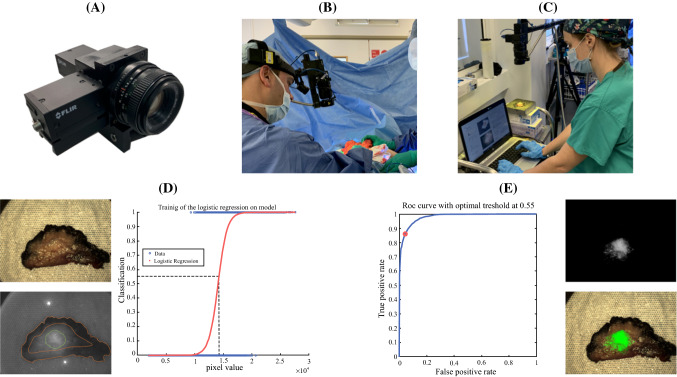
Fig. 1.
a Photographic illustration of the in-house dual camera head fluorescence system (Elson Lab, Imperial College, London).13b Image acquisition of the tumor in situ. c Image acquisition of the excised tumor. d Left: example raw color image (top) and fluorescence image (bottom) with contouring of tumor (in green) and histologically confirmed healthy tissue (between dotted orange lines) ground truth regions. Right: use of 70% of the contoured ground truth regions to train the classification model. e Left: use of the remaining contoured ground truth regions to validate the trained model through ROC analysis. In this example, the area under the curve (model accuracy) is 0.98 and when 0.55 [probability for tumor, corresponding to 1.43 × 104 pixel value (dashed line in d)] is used as the classification threshold the sensitivity and specificity are 0.86 and 0.96, respectively. Right: example of processed fluorescence image (top), where pixel values below 1.43 × 10⁴ are suppressed to zero, and color image (bottom) overlaid with green pseudo-color map indicating probability for tumor upon testing of the trained model across the entire raw fluorescence image

