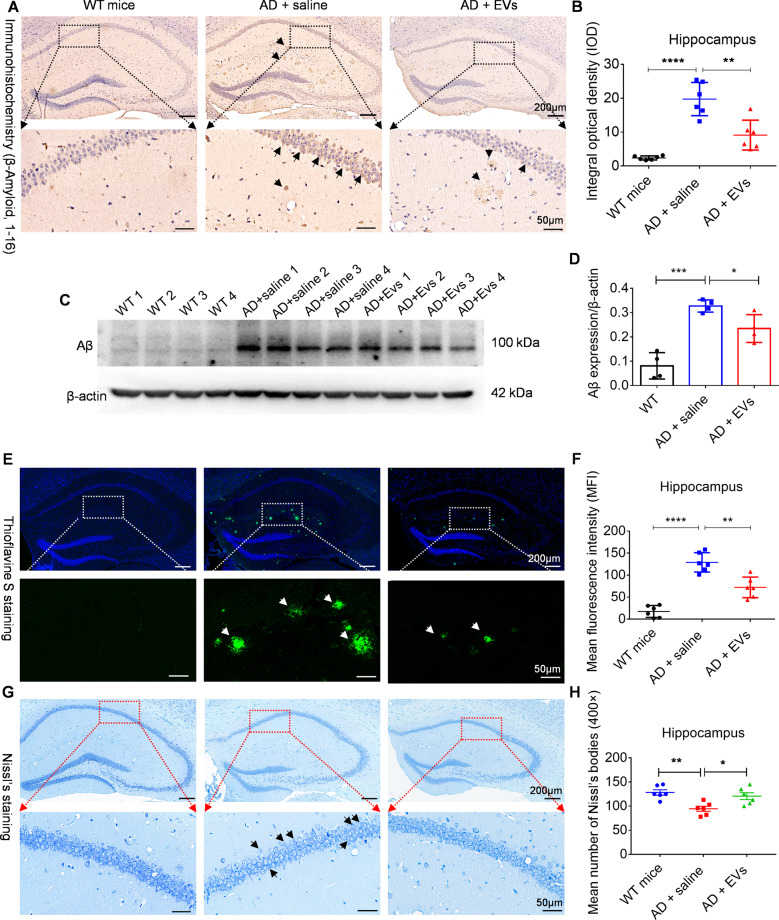
Fig. 2. Tail vein injection of MSC-EVs reduces the hippocampal Aβ aggregation and neuronal loss in APP/PS1 mice.
A After MSC-EVs injection for 1 month, A β amyloid 1, 16 (Aβ) immunohistochemistry images present the deposition of Aβ in the hippocampal regions of experimental mice (bar = 200 μm); areas in squares (up), at higher magnification (down) (bar = 50 μm), show the distinction of Aβ aggregation in hippocampus (black arrowheads) among three groups. B Histogram display the integral optical density (IOD) of Aβ aggregation in the experimental groups (n = 6). C Western blotting for the Aβ expression at 1 month in wild-type (WT) and APP / PS1 mice. D Statistic analysis show the relative expression of Aβ / β-actin in each group (n = 4 per group). E Thioflavine S staining present MSC-EVs-mediated changes in terms of Aβ aggregation in hippocampus (bar = 200 μm), and in the down panel, Aβ deposition (green, white arrowheads) is shown at higher magnification (bar = 50 μm). F Plaque quantification in hippocampus appears as mean fluorescence intensity (MFI) in each group (n = 6 per group). G Representative images show the Nissl’s staining in the experimental groups (bar = 200 μm), and the higher magnification of square areas display the Nissl’s body loss in hippocampus of each group (bar = 50 μm). H Histogram show the mean number of Nissl’s bodies (400×) in the experimental groups (n = 6 per group). Quantification data are expressed with Mean ± SEM. The data meet normal distribution and the variance is homogeneous. *P < 0.05, **P < 0.01, ***P < 0.001, ****P < 0.0001.

