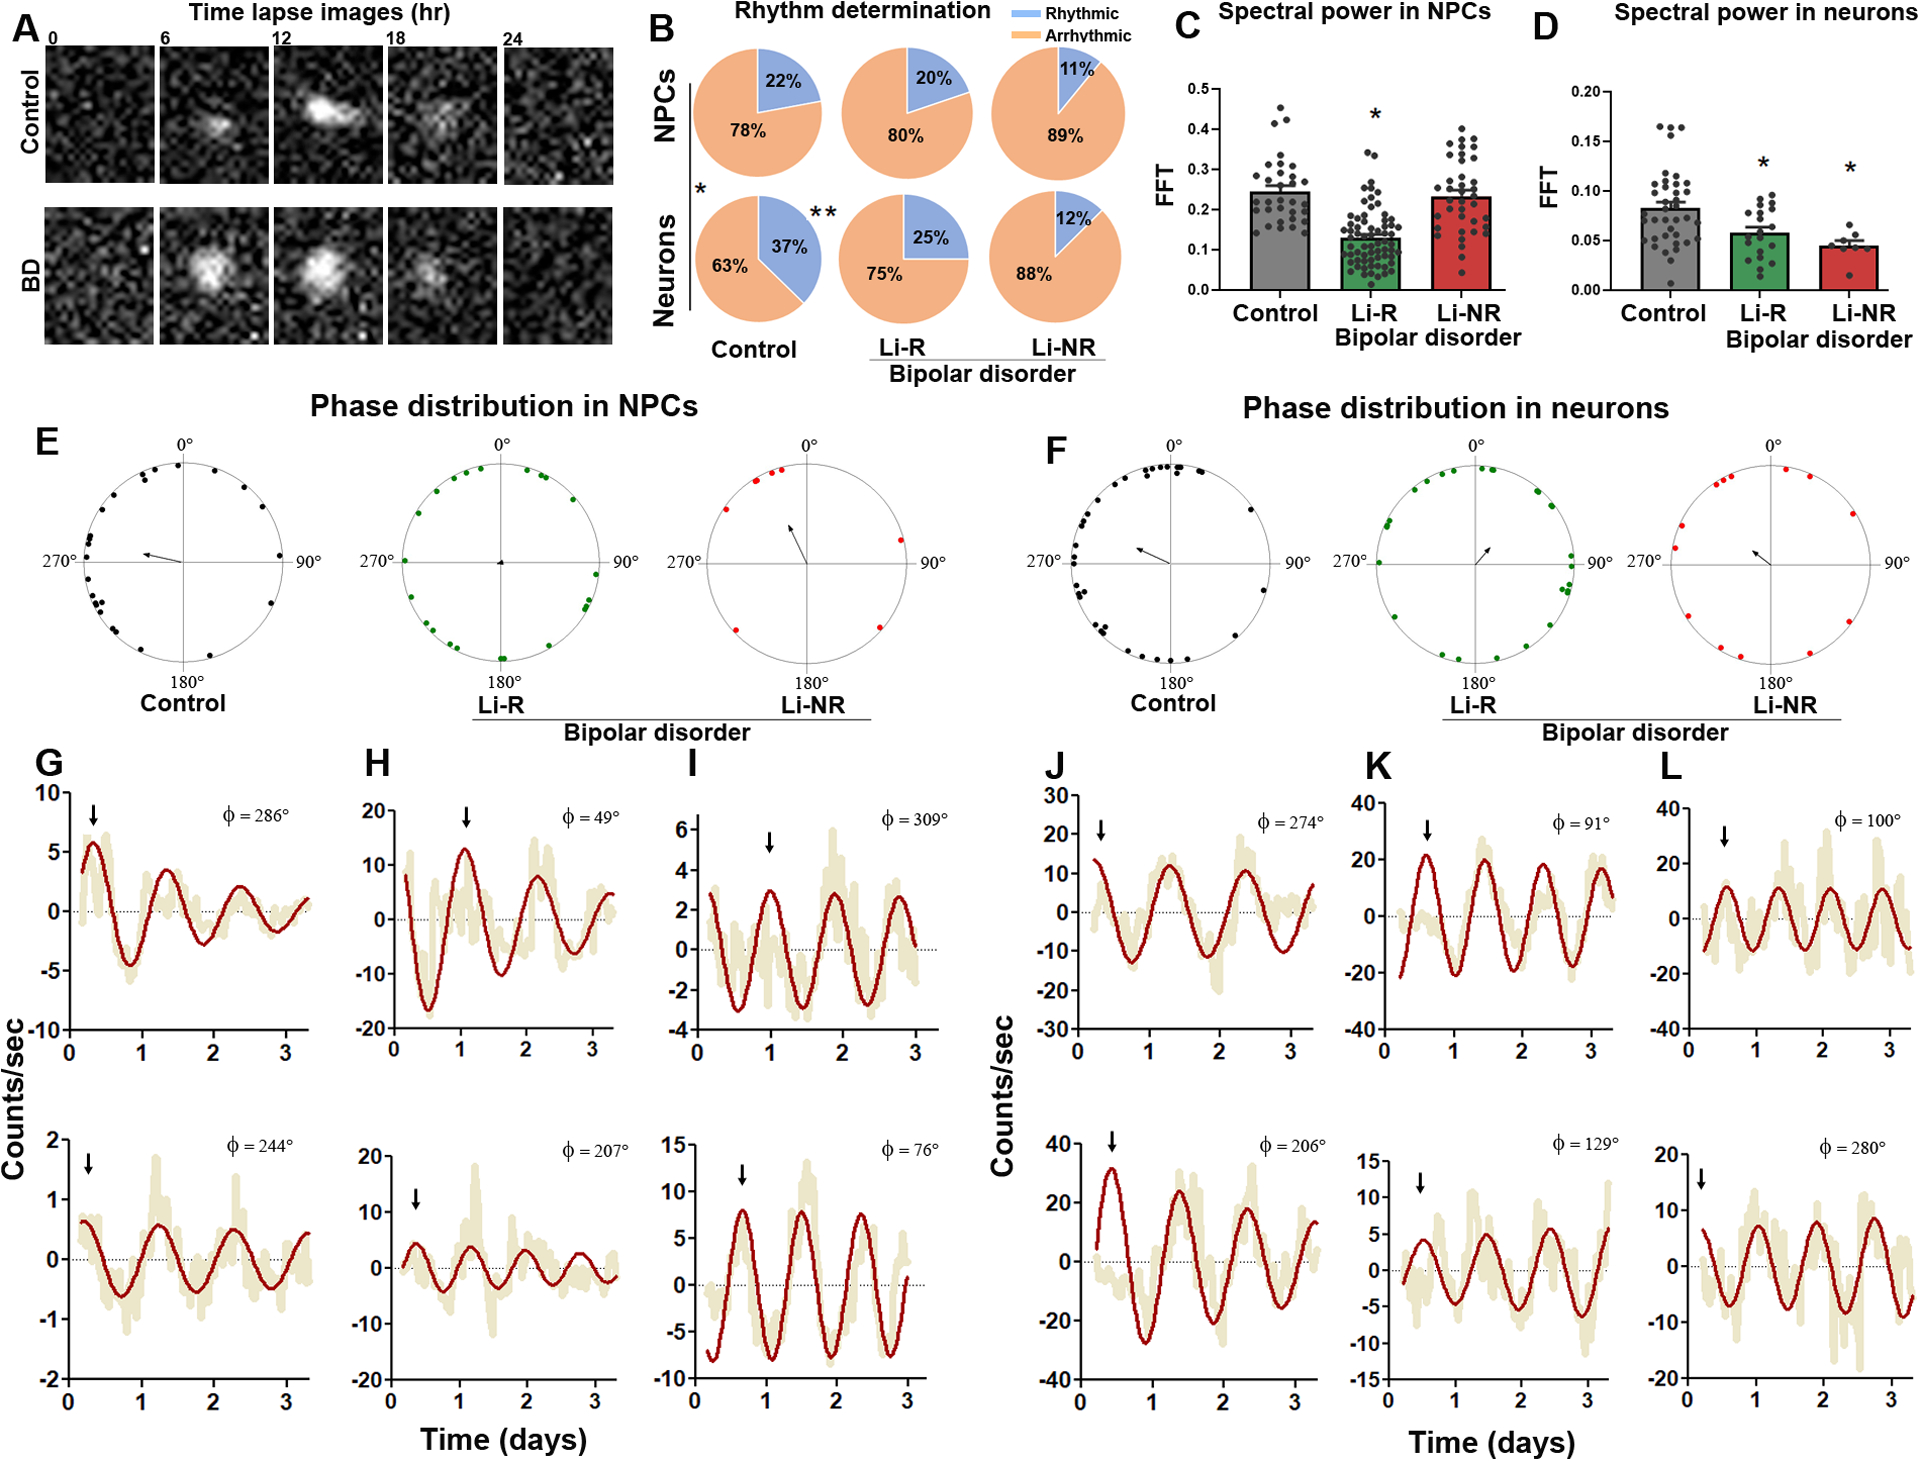
Figure 3: Single-cell assays of circadian rhythms in NPC and neurons.

(A) Representative time-series images of Per2-luc rhythms in single neurons from a control and BD donor. (B) Pie charts describing the proportion of cells meeting the definition of rhythmic from control, lithium responder (Li-R) and lithium non-responder (Li-NR) donors. In control samples, the proportion of rhythmic cells increased in differentiated neurons vs. neural progenitor cells (NPCs) (control: χ2 = 6.1(1), p<0.05, indicated by * and vertical line). In cells from Li-R and Li-NR, NPCs and neurons were rhythmic in similar proportions suggesting a lack of developmental effect on the circadian clock in these BD samples [Li-R: χ2=0.54 (1), p=0.46, Li-NR: χ2=0.04(1), p=0.84]. In NPCs, the proportion of rhythmic cells was similar across controls, Li-R and Li-NR [χ2=4.02 (2), p=0.13]. In neurons, there were significantly more rhythmic cells in control vs. Li-R and Li-NR samples [χ2 = 6.23 (2), p < 0.05 indicated by **]. (C, D) Single-cell rhythm strength, as measured by relative spectral power in the circadian range. In Li-R, both NPCs and neuron rhythms were weaker vs. controls. In Li-NR, while the total number of rhythmic NPCs was low, those that were detected had normal rhythm strength, whereas rhythmic neurons from Li-NR had significantly weaker rhythms (Analyses by one-way ANOVA revealed for NPCs: F=6.62 p<0.005; neurons: F=6.58 p<0.005. For NPC: N=60–80 cells/line from n=2 control, 2 Li-R, and 1 Li-NR donor, for neurons: N=60–80 cells/line from n=3 control, 2 Li-R, and 1 Li-NR donor). Single-cell analyses indicate significant circadian phase clustering in control NPCs (E) and neurons (F) (Rayleigh test, p = 0.01), but not in NPCs or neurons from Li-R or Li-NR subjects (p>0.05). Phase is shown using polar coordinates, with dots indicating circadian phases of individual cells. Because phase is undefined in non-rhythmic cells, only rhythmic cells are plotted, and the number of plotted cells is therefore smaller for Li-NR NPCs and neurons. Arrows indicate the mean phase vector for each group. Example pairs of rhythm traces from control, Li-R, and Li-NR NPCs (G-I) or neurons (J-L) are shown, illustrating representative phase relationships among single-cells from each group (compare top vs. bottom). Yellow indicates raw counts, red indicates best fit curve. Φ indicates phase value (0–360°). Arrows indicate times of first peaks, to facilitate visual comparisons of phase between traces.
