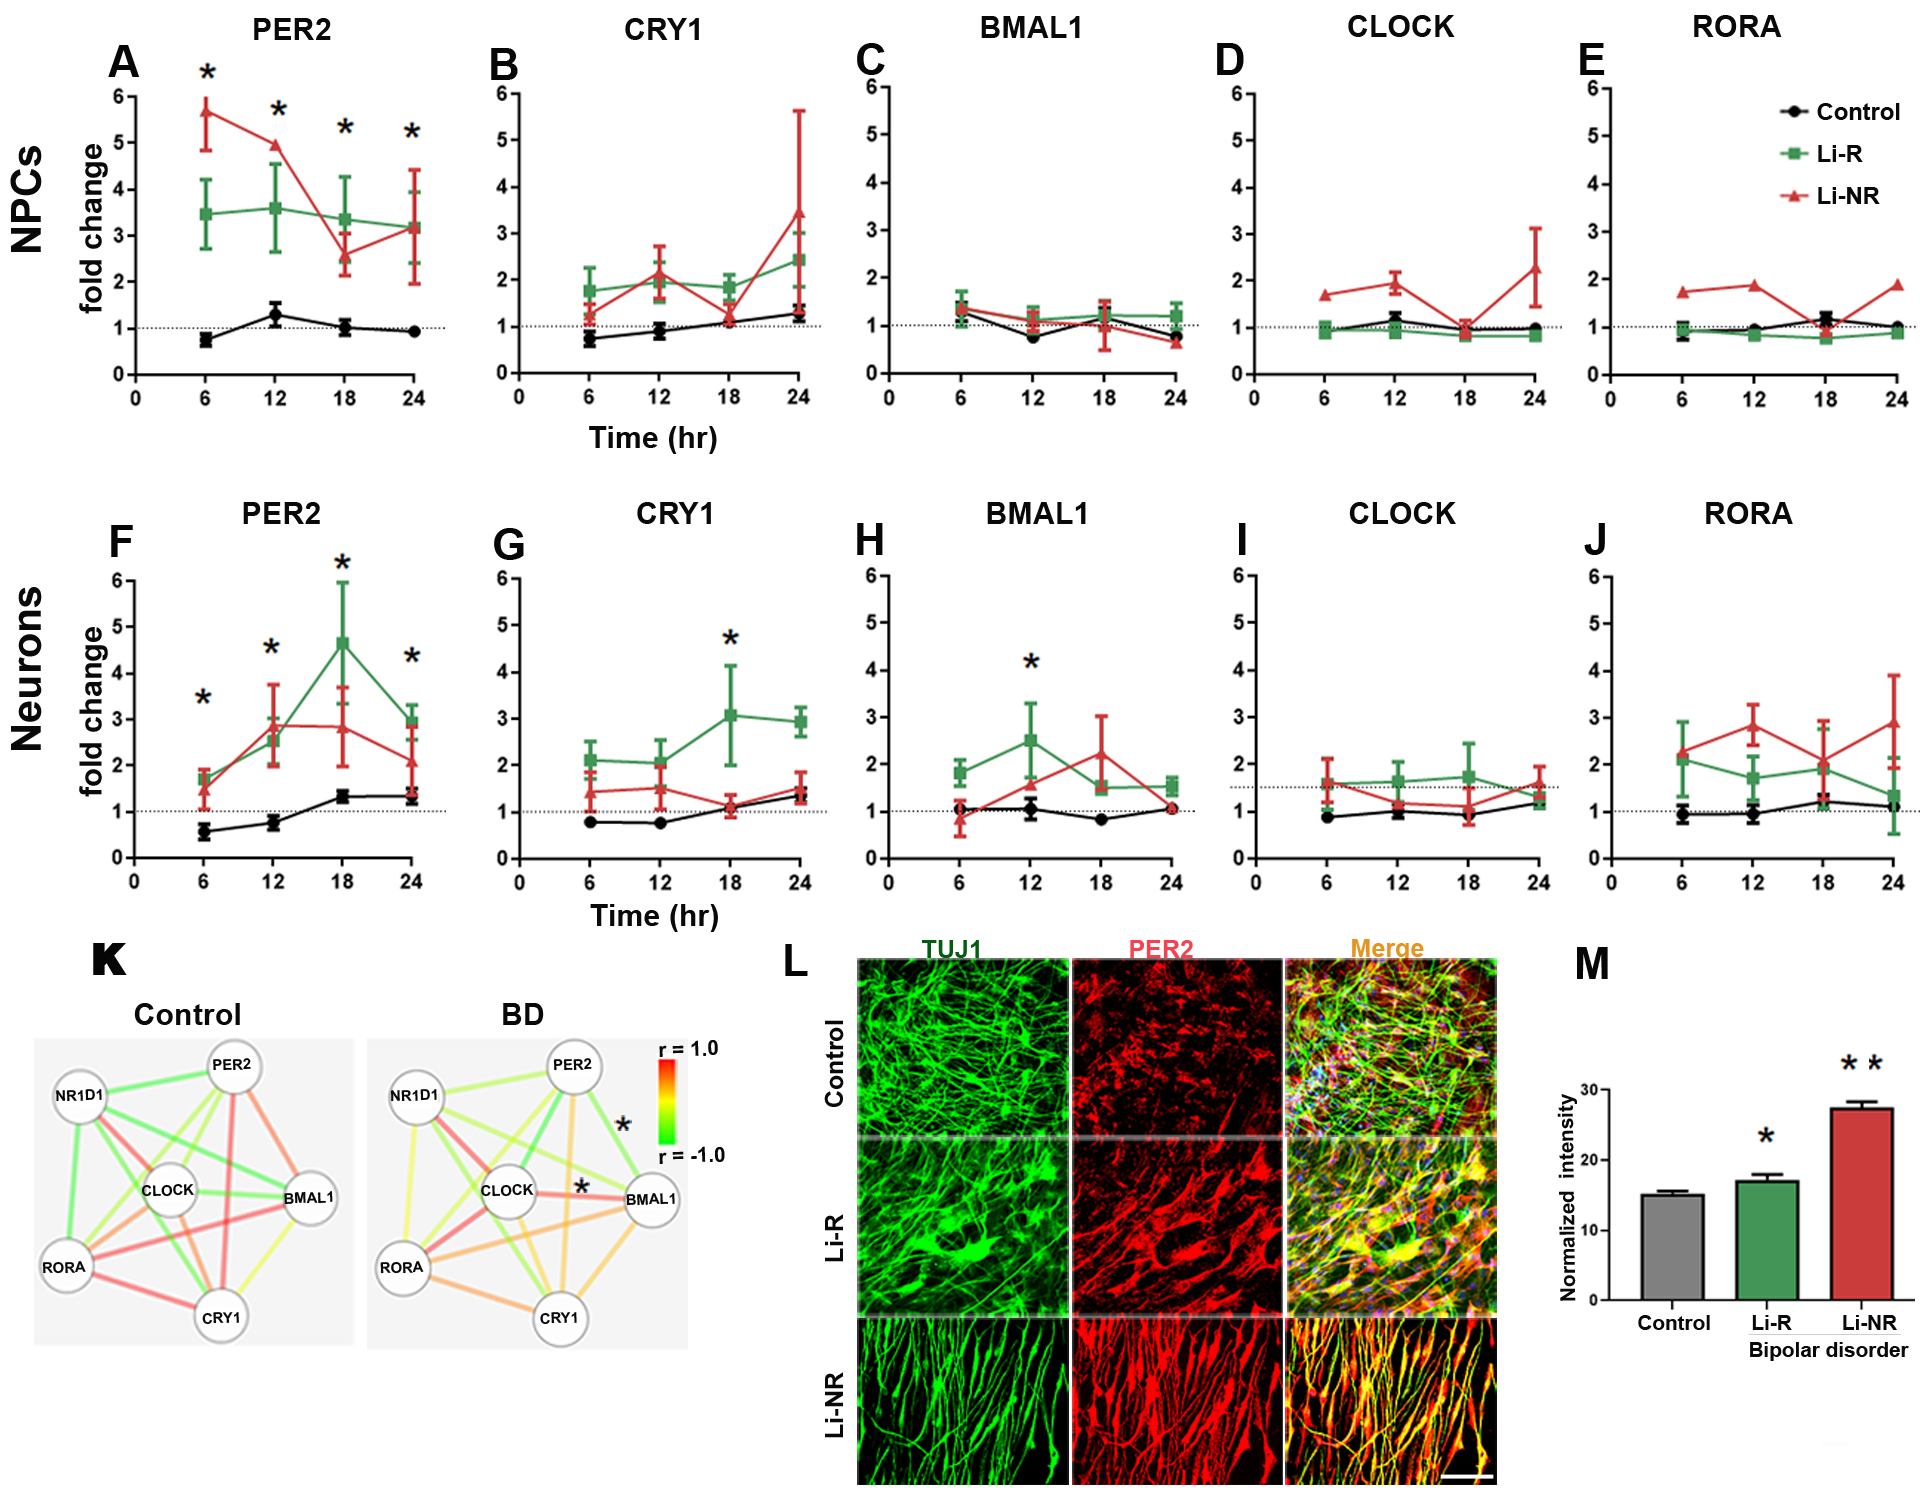
Figure 4: Circadian clock gene expression in NPCs and neurons.

Results of RT-PCR 24 h time course experiments performed on mRNA collected at 6 h intervals in NPCs (A-E) and neurons (F-J). Data from controls (black), Li-R (green) and Li-NR (red) are shown. Results were analyzed with two-way ANOVA: * indicates a main effect of diagnosis in post-hoc test (p < 0.05). For each probe, expression was first normalized to GAPDH, and then to mean target expression over 24 h (dotted line). NPC means reflect controls: n=3 donors with 3–5 replicates/sample, Li-R: n=2 donors with 7–10 replicates/sample, Li-NR: n=2 donors with 7–10 replicates/sample. Neuron means reflect controls: n=3 donors with 4–5 replicates/sample, Li-R: n=2 donors with 7–10 replicates/sample, Li-NR: n=3 donors with 7–10 replicates/sample. All experiments were run in triplicate. (I) Clock gene network in BD and control neurons. Nodes indicate gene, edges indicate pairwise correlation. * indicates significant (p<0.05) difference in correlation coefficient (determined by two-way ANOVA with post-hoc test). (L-M) PER2 protein expression in control, Li-R and Li-NR neurons. PER2 expression was significantly higher in both groups of BD neurons (mean immunoreactivity in arbitrary units) ± SEM: control: 15.26 ± 0.34, Li-R 17.24 ± 0.72, Li-NR 27.47± 0.88, One-way ANOVA revealed F=112, p<0.0001, data reflect results from n= 350 control, 220 Li-R, 160 Li-NR neurons (quantified by DAPI staining), from n=3 control, 2 Li-R and 3 Li-NR donors). Post-test revealed * p<0.05 vs control, **p<0.001 vs control and Li-R. Error bars indicate standard error of the mean (SEM).
