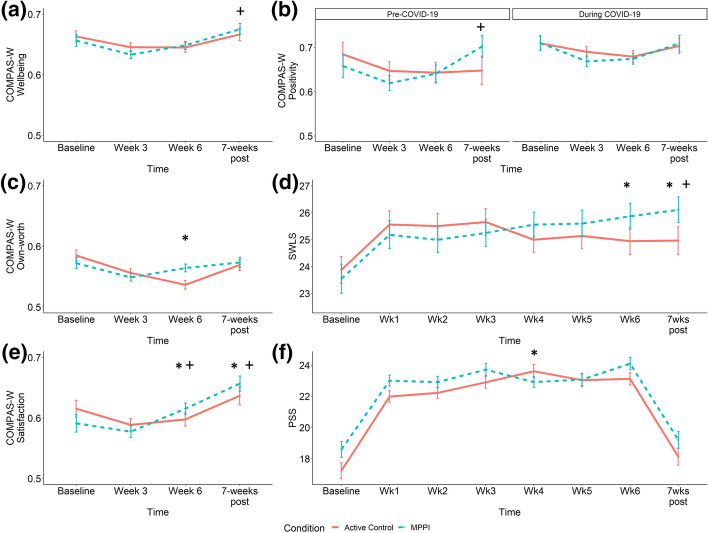
Fig. 2.
Signficant overall effects of the intervention relative to the active control group for a COMPAS-W Wellbeing, b COMPAS-W Positivity (moderated by COVID-19 restrictions), c COMPAS-W Own-worth, d Satisfaction with Life Scale (SWLS), e COMPAS-W Satisfaction, and f Perceived Stress Scale (PSS) scores. *Indicates significantly larger improvements in the intervention group compared to the control group relative to baseline without accounting for COVID-19 restrictions. + Indicates significantly larger improvements in the intervention group compared to the control group relative to baseline when accounting for COVID-19 restrictions. COMPAS-W scores have been normalised to a scale of 0–1 for comparative purposes

