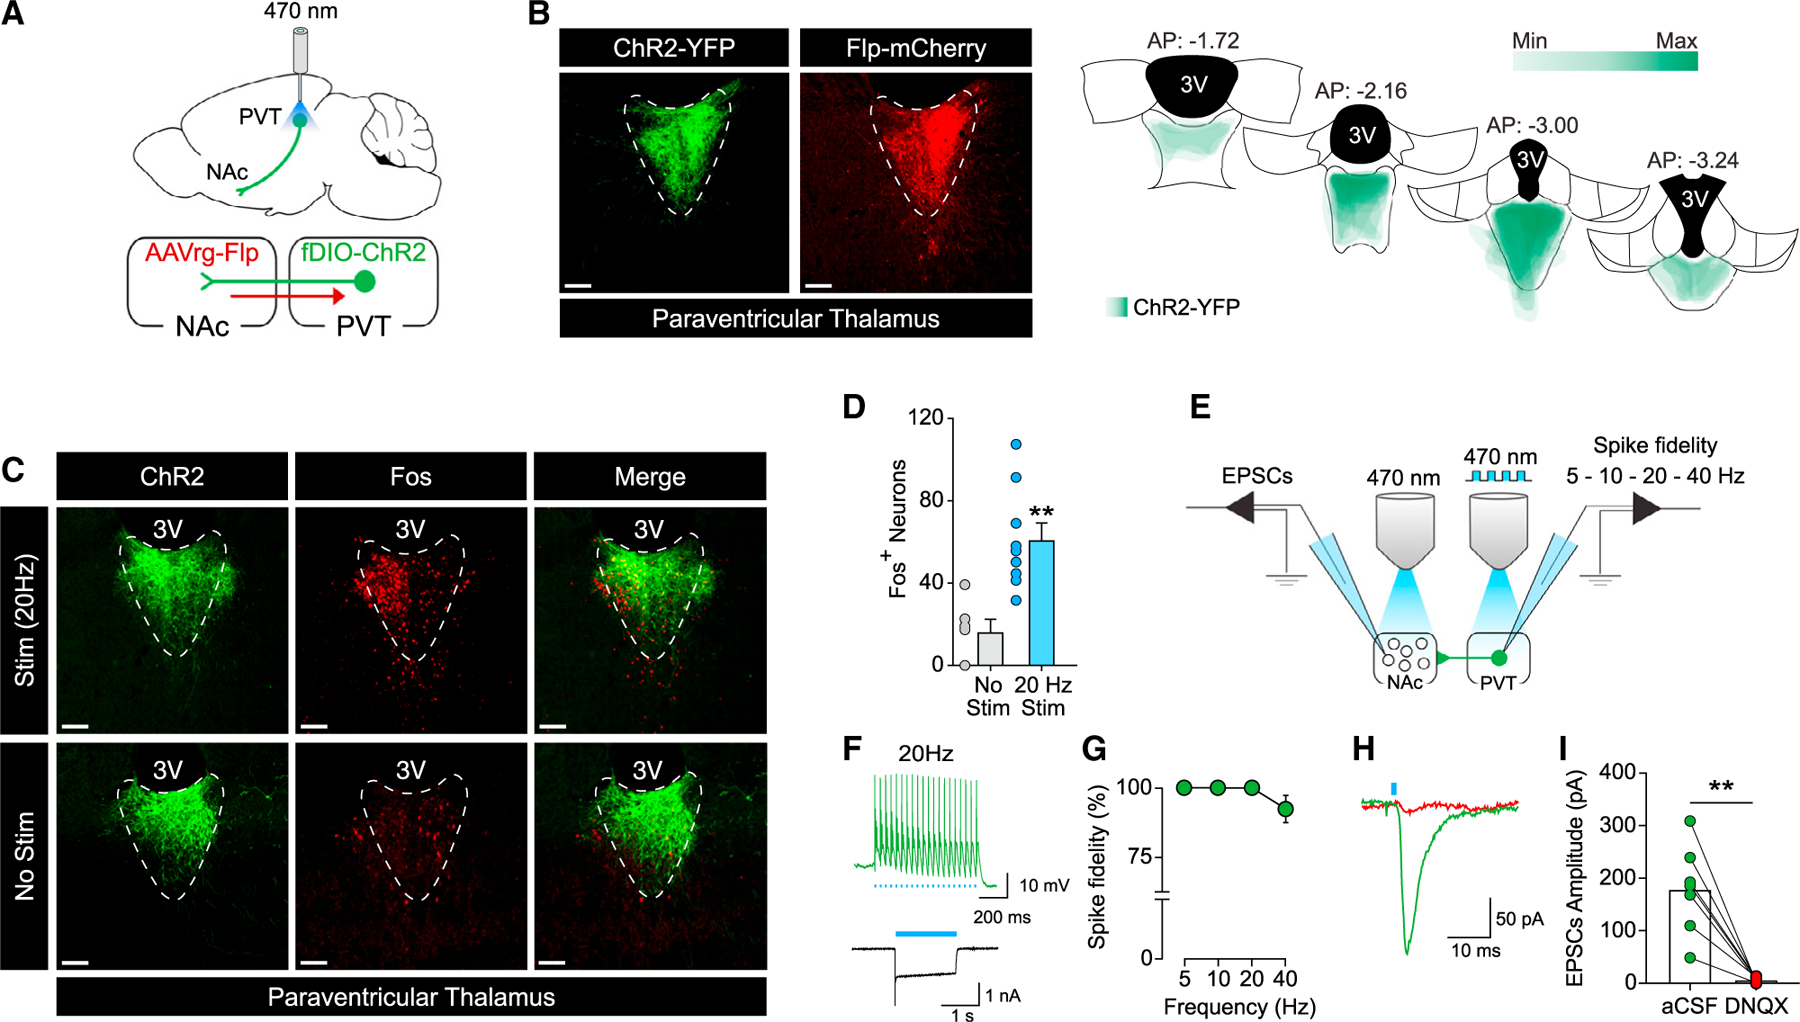
Figure 1. Validation of the combinatorial virus approach and optogenetic parameters.

(A) Schematic illustration of combinatorial virus approach and optogenetic approach used to target the PVT→NAc pathway.
(B) Representative images (left) of ChR2-eYFP (green) and Flp-mCherry (red) expression in the PVT neurons. Placement map (right) shows ChR2-YFP spread in the PVT (each animal represented at 10% opacity).
(C) Optogenetic stimulation (stim, 20 Hz, 20 ms) of ChR2-expressing neuron in the PVT induced Fos (top) compared to the non-stimulation condition (no stim, bottom).
(D) Quantification of Fos-positive cells in PVT neurons (no stim, n = 6; stim, n = 9; **p < 0.01 versus no stim condition).
(E) Schematic illustration of the slice electrophysiology approach employed to investigate ChR2 functionality in the PVT neurons (left) and functional connectivity of the PVT→NAc pathway (right).
(F) Example traces of photo-evoked (20 Hz) action potentials (top) and photocurrent (bottom) in ChR2-expressing PVT neurons.
(G) Quantification of light-evoked action potential firing at different frequencies of light stimulation (5, 10, 20, and 40 Hz) in ChR2-expressing PVT neurons (n = 11 cells/3 rats).
(H and I) Example trace (H) and quantification (I) of EPSCs recorded from NAc neurons after optical stimulation of ChR2-expressing PVT terminals in NAc before and after bath application of DNQX (n = 7 cells/3 rats; **p < 0.01 versus aCSF).
Scale bars, 50 μm. Data are shown as mean ± SEM.
